
Figure 4. PLP and PCM position is dictated by the timing of PLP expression.
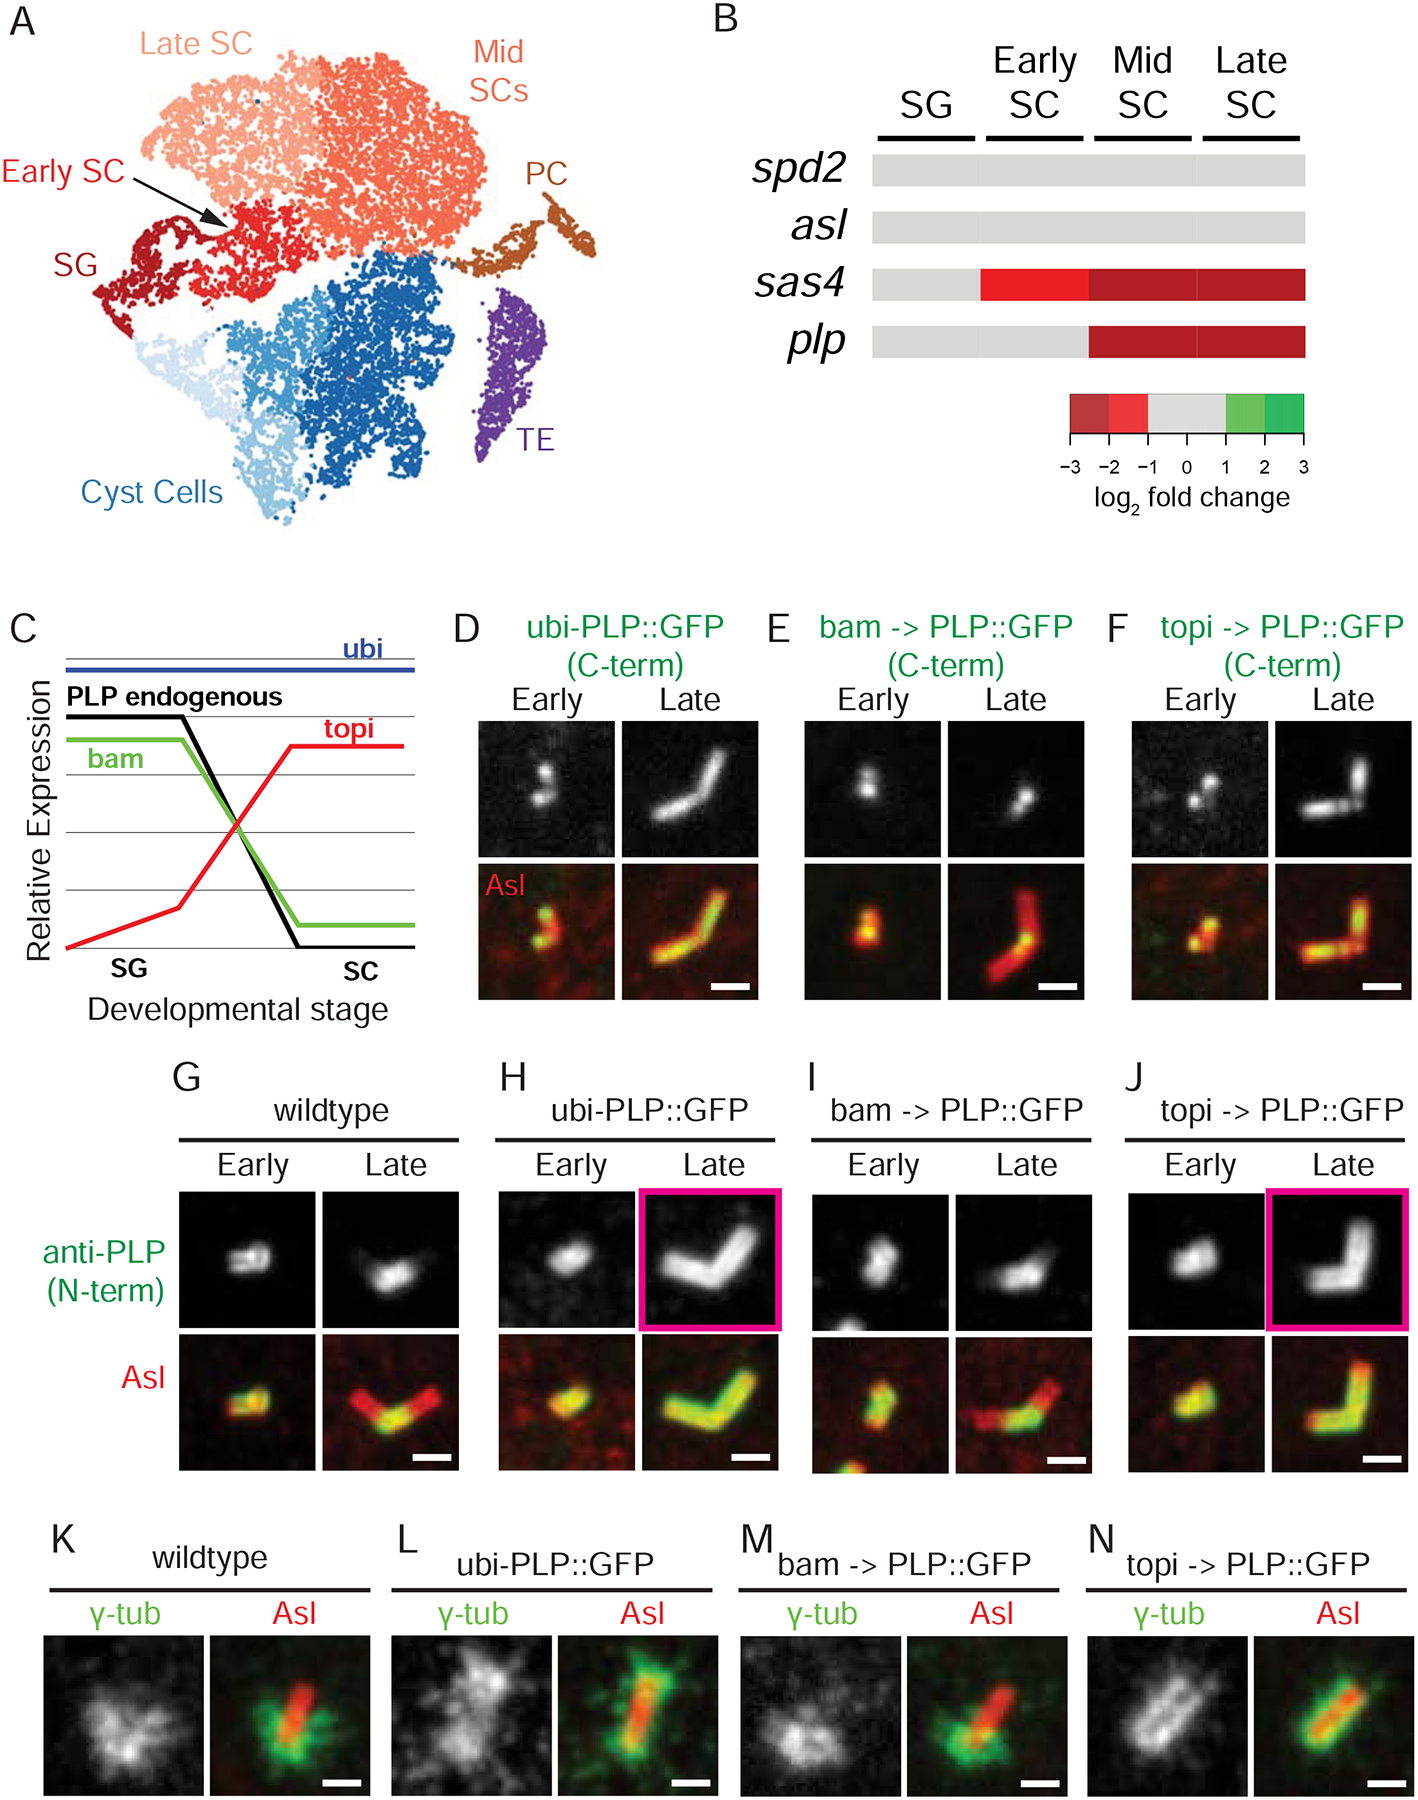
A) tSNE plot showing clusters of sequenced single cells color coded based on the cell type identified from known expression patterns. Somatic cells: Cyst Cells, Terminal Epithelia (TE), Pigment Cells (PC). Germline cells: SG, Early SCs, Mid SCs, and Late SCs. B) Expression of spd2, asl, sas4 and plp (rows) throughout germline developmental stages (columns). The RPKM for each gene was determined from all the cells assigned to a cluster. The log2 fold change, relative to SG at each stage (increase - green shades; decreased - red shades). Sas4 and PLP levels are lower in SC than in SG. C) Schematic of relative PLP levels driven by bam-Gal4 (green), topi-Gal4 (red), and ubi-PLP (blue) compared to endogenous (black) in SG vs SC. D-F) Position of exogenous PLP::GFP (green) determined by direct fluorescence along the centriole (Asl, red) under control of the ubi (D), bam (E) and topi (F) promoters in early and late SCs. G-J) Position of PLP (green = endogenous and exogenous) along the centriole (Asl, red) using N-terminal anti-PLP antisera in early and late SC in wildtype (G) and in flies expressing ubi (H), bam (I) and topi (J) driven PLP::GFP. Pink boxes in H and J highlight the elongation of PLP. Note: The N- and C-termini of PLP have distinct radial localizations with the N-terminus further from the center than the C-terminus (Lawo et al., 2012; Mennella et al., 2012). K-N) Position of γ-tub (green) along the centriole (Asl, red) in metaphase of meiosis II in wildtype (K) and in flies expressing ubi (H), bam (I) and topi (J) driven PLP::GFP. The proximal centriole end is positioned down in all panels. Bars = 1 μm