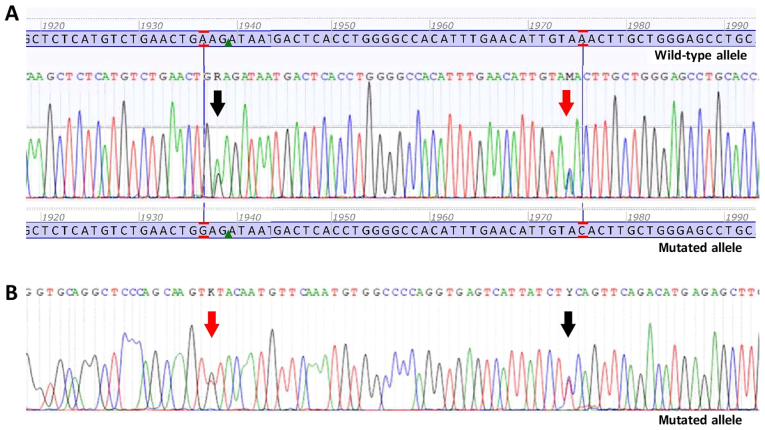
Figure 1.
Sanger sequencing electropherograms of double mutant gastrointestinal stromal tumour. (A) Forward sequence. Black arrow is indicating the nucleotide change c. 1936A>G p.(Lys627Glu) in PDGFRA exon 14. Red arrow is indicating the nucleotide change c.1975A>C p.(Asn659His) in PDGFRA exon 14. (B) Reverse sequence. Black arrow is indicating the nucleotide change c. 1936A>G p.(Lys627Glu) in PDGFRA exon 14. Red arrow is indicating the nucleotide change c.1975A>C p.(Asn659His) in PDGFRA exon 14.

