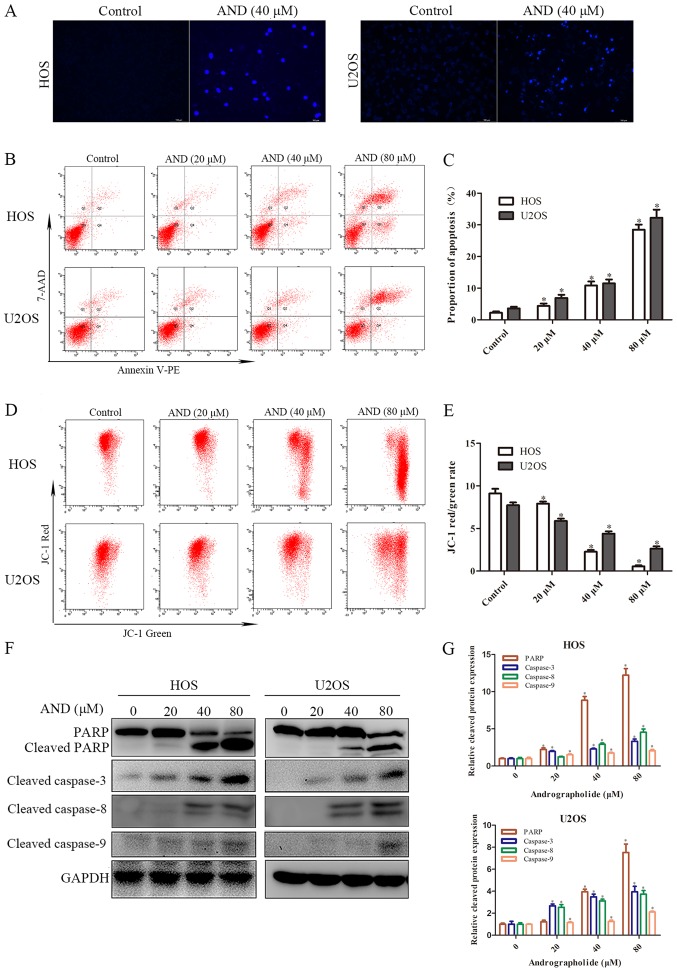
Figure 2.
AND induces apoptosis in osteosarcoma cells. (A) HOS and U2OS cells were treated with AND, and the apoptotic morphological changes were evaluated by fluorescence microscopy using Hoechst 33258 staining. (B and C) HOS and U2OS cells were stained with Annexin V-PE/7-AAD following exposure to various concentrations of AND. Apoptosis was evaluated by flow cytometry. (D and E) Mitochondrial membrane potential was detected by flow cytometry using the JC-1 fluorescent probe. Changes in the JC-1 red/green ratio from three separate experiments are illustrated in the chart. (F) Cells were treated with various concentrations of AND for 24 h and the expression of cleaved PARP, caspase-3, -8 and -9 was examined by western blot analysis. (G) Histogram shows the relative cleaved protein expression of cells exposed to various concentrations of AND for 24 h. *P<0.05 vs. control. AND, andrographolide; PARP, Poly(ADP-ribose) polymerase.

