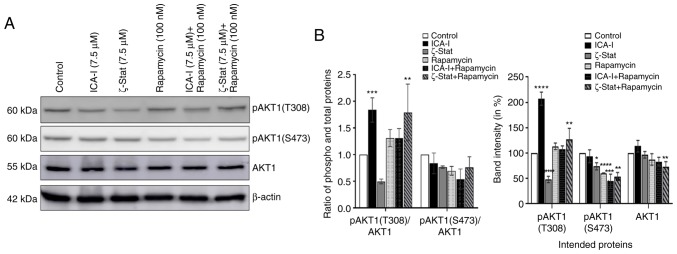
Figure 8.
Combination of atypical PKC inhibitors and rapamycin affects the activation of AKT1 in bladder cancer cells. (A) Expression of phospho (both at S473 and T308 positions) and total AKT1 following 3 days of treatment with atypical PKC inhibitor and rapamycin combinations. (B) Bar chart indicating the corresponding band intensities. β-actin was used as a loading control. All experiments were performed at least three times. Data are presented as the mean ± SEM. *P<0.05, **P<0.02, ***P<0.01 and ****P<0.0001 vs. untreated control cells. p, phosphorylated; PKC, protein kinase C.

