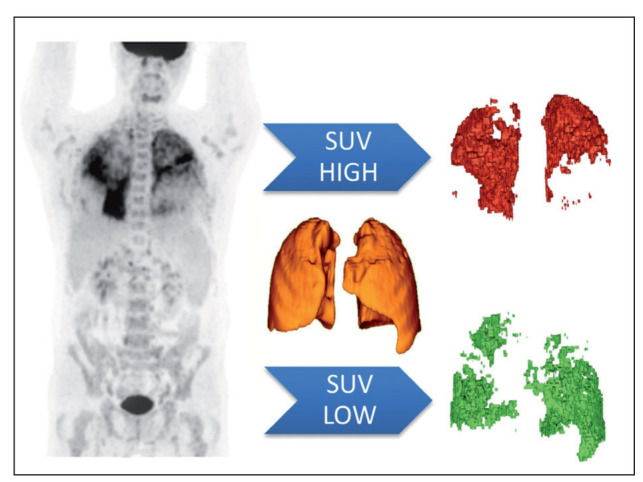
Fig. 1.

Image analysis using total lung volumes from combined PET and CT data. The lungs are segmented on low dose (LD) CT data, used for PET attenuation correction. PET volumes of SUV high and low are be based upon a specific SUV threshold (set to 1.0), so there are no overlapping areas. In this case, the patient demonstrates a high metabolic activity in the upper lobes, while the lower metabolic activity is seen in the lower areas. [Red: volume of SUV data above threshold; Green: volume of SUV data below threshold]
