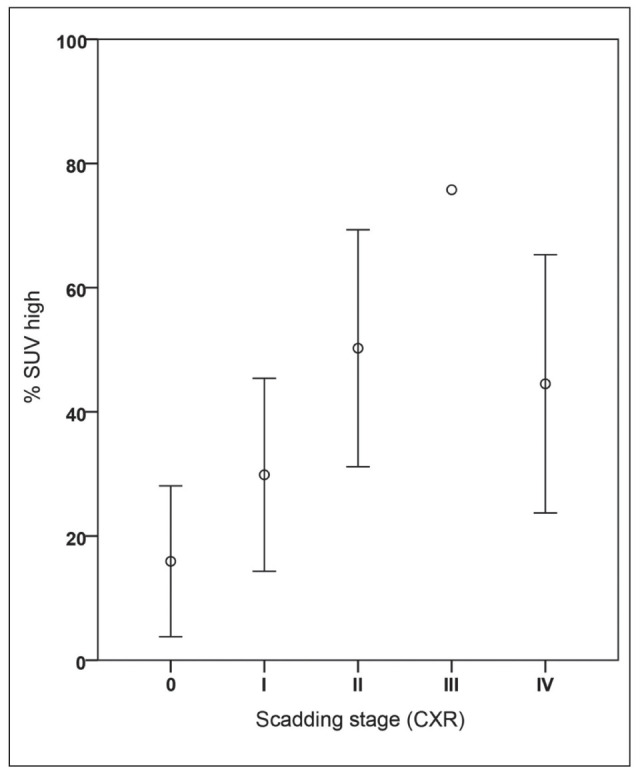
Fig. 3A.

Plots of FDG PET/CT parameter (%SUV-high) per radiological Scadding category in patients with sarcoidosis (n=35). This figure illustrates the differences per Scadding category based on the chest x-ray. Note the difference between stage 0 and other stages. In stage 0 there is about 16% of increased SUV in the lung detected on FDG PET. Stage I seems to be an intermediate stage between 0 and II with almost 30% lung tissue showing increase in FDG uptake. There seems to be no difference between the stages II to IV on FDG PET (around 50%); see also table 5
