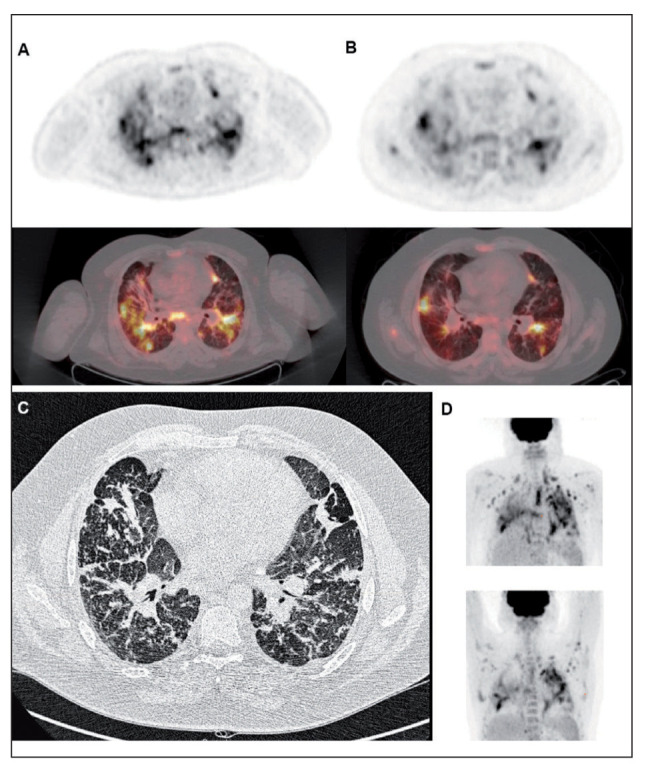
Fig. 5.

Figure of Case 8. Patient with stage IV sarcoidosis demonstrates high FDG uptake on the initial FDG PET/CT (A) and the second FDG PET 1 year later (B); top images are axial views of FDG PET and bottom are axial views of fused PET/CT. There is decrease of FDG uptake after therapy, however still persistent active areas are visible. (C) high resolution CT axial image, which demonstrate extensive fibrosis as well as some small consolidation areas. (D) the maximum intensity project (MIP) of initial FDG PET (top) vs 1 year follow-up FDG PET (bottom)
