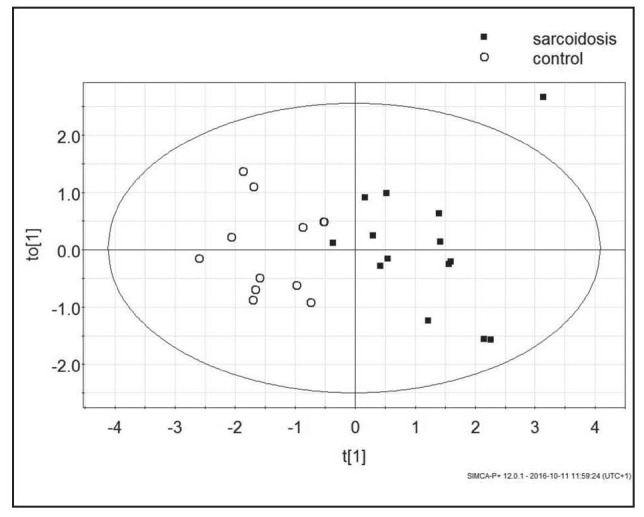
Fig. 1.

The scores plot of the two-component OPLS-DA model; to[1] represents within class variation in the first orthogonal component, whereas t[1] represents between class variation in the first predictive component. Ellipse represents Hotelling T2 with 95% confidence in score plots
