Fig. 2.

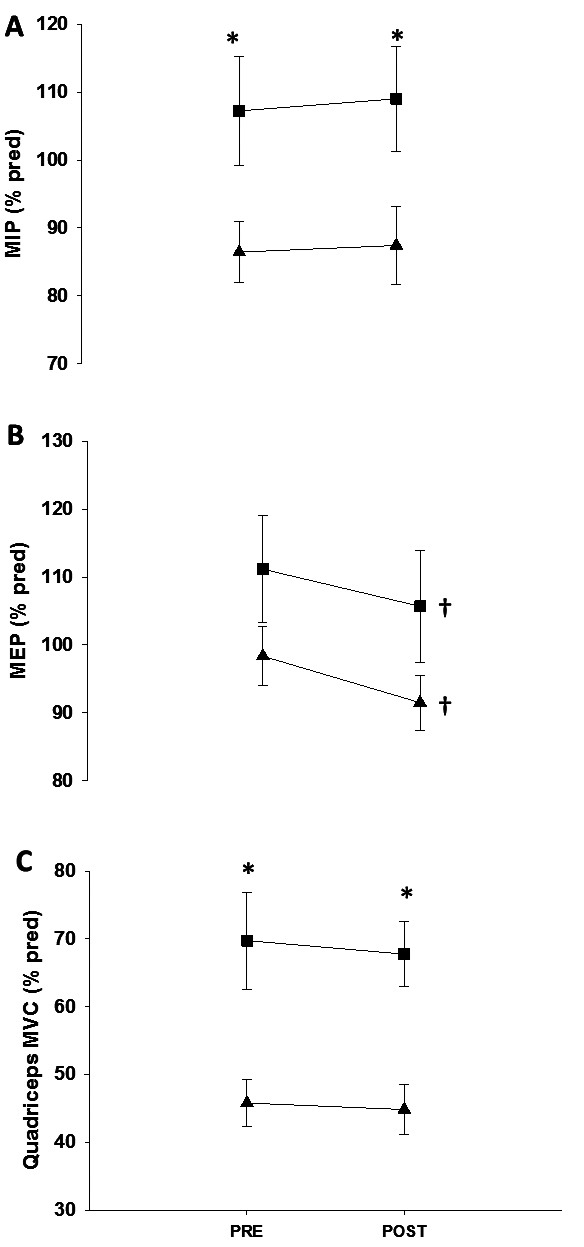
Skeletal muscle force before and after maximal exercise testing in patients (▲) and healthy controls (■).
Definition of abbreviations: see Table 1.
* P<0.05 between groups in a given moment.
† P<0.05 intra-group.

Skeletal muscle force before and after maximal exercise testing in patients (▲) and healthy controls (■).
Definition of abbreviations: see Table 1.
* P<0.05 between groups in a given moment.
† P<0.05 intra-group.