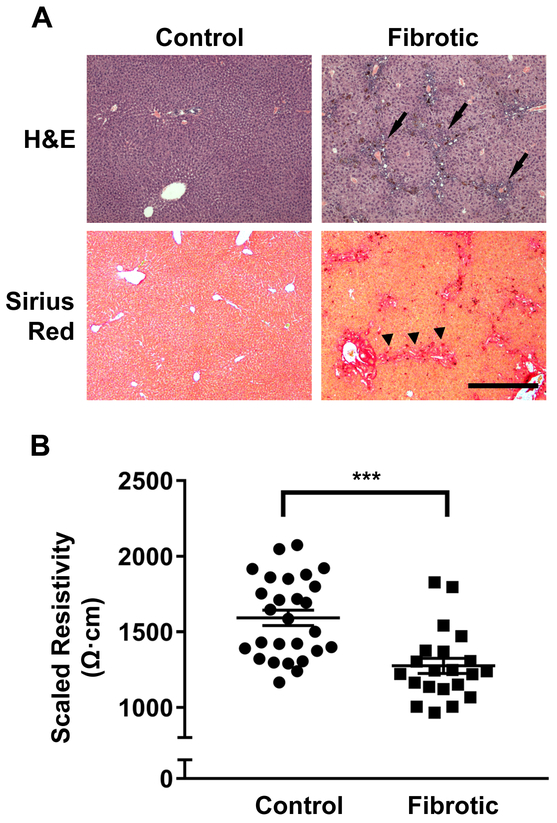
Figure 1. Fibrotic liver tissue with peri-portal inflammation and collagen deposition demonstrates lower electrical resistivity than non-fibrotic liver tissue.
(A) Hematoxylin and eosin (H&E) and Sirius Red histologic staining of control non-fibrotic and fibrotic liver tissue. After 4 weeks of 0.1% DDC diet, mice develop peri-portal inflammatory infiltrates (arrows) and collagen deposition with portal-portal bridging fibrosis (arrowheads). Magnification 4x. Scale bar = 500μm for all images. (B) Baseline resistivity is significantly lower in fibrotic liver compared to control non-fibrotic liver. Liver tissue resistivity at 10kHz was determined in control mice (n=27) and mice fed a 0.1% DDC diet for 4 weeks (n=21). ***p<0.001 by Student’s t-test.

