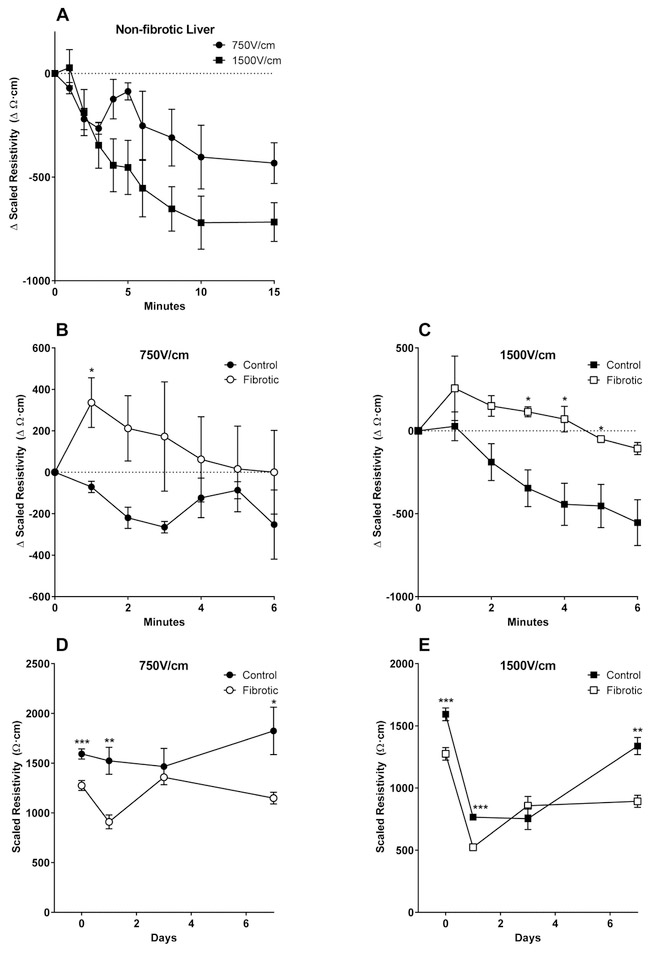
Figure 2. Liver tissue resistivity after IRE treatment is modulated by the electric field strength and presence of fibrosis.
The change in tissue resistivity at 10kHz (Δ Ω·cm) was determined by subtracting the pre-IRE baseline resistivity from the resistivity determined at 1, 2, or 5 minute intervals post-IRE for up to 15 minutes (A-C) or absolute resistivity (Ω·cm) was determined at 10kHz at baseline prior to IRE (day 0) and at 1, 3, or 7 days after IRE treatment (D-E). (A) Early response of control non-fibrotic liver after 750V/cm or 1500V/cm IRE treatment. (B) Early response of control versus fibrotic liver tissue after 750V/cm IRE. (C) Early response of control versus fibrotic liver tissue after 1500V/cm IRE. (D) Later response of control versus fibrotic liver tissue after 750V/cm IRE. (E) Later response of control versus fibrotic liver tissue after 1500V/cm IRE. Day 0 resistivity data shown in D-E are the baseline resistivity data presented in Figure 1. All other resistivity data represent measurement in 3-5 independent animals in each group of mice at each timepoint (n=3-5). Regression coefficients (i.e. slopes that represent the rate of resistivity decrease) comparing 750V/cm versus 1500V/cm in non-fibrotic liver (A) and control versus fibrotic liver after 1500V/cm treatment (C) are significantly different (p<0.05). Asterisks show the timepoints in which resistivity was significantly different between control and fibrotic liver (B-E). *p<0.05, **p<0.01, ***p<0.001 by Student’s t-test. Error bars represent SEM.

