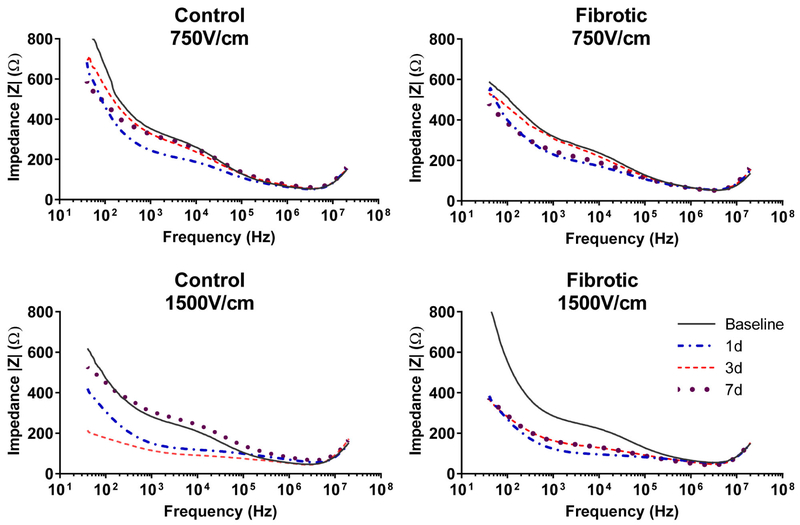
Figure 3. Impedance of non-fibrotic liver returns to baseline by day 7 after IRE treatment, whereas impedance of fibrotic liver remains significantly depressed.
Lines represent the magnitude of tissue impedance (|Z|) in the livers of representative mice in each group as determined through the entire range of electrical frequencies. By day 7 after IRE, the impedance of control non-fibrotic liver returns to pre-treatment baselines. In contrast, the impedance of fibrotic liver after 1500V/cm IRE remains significantly reduced.

