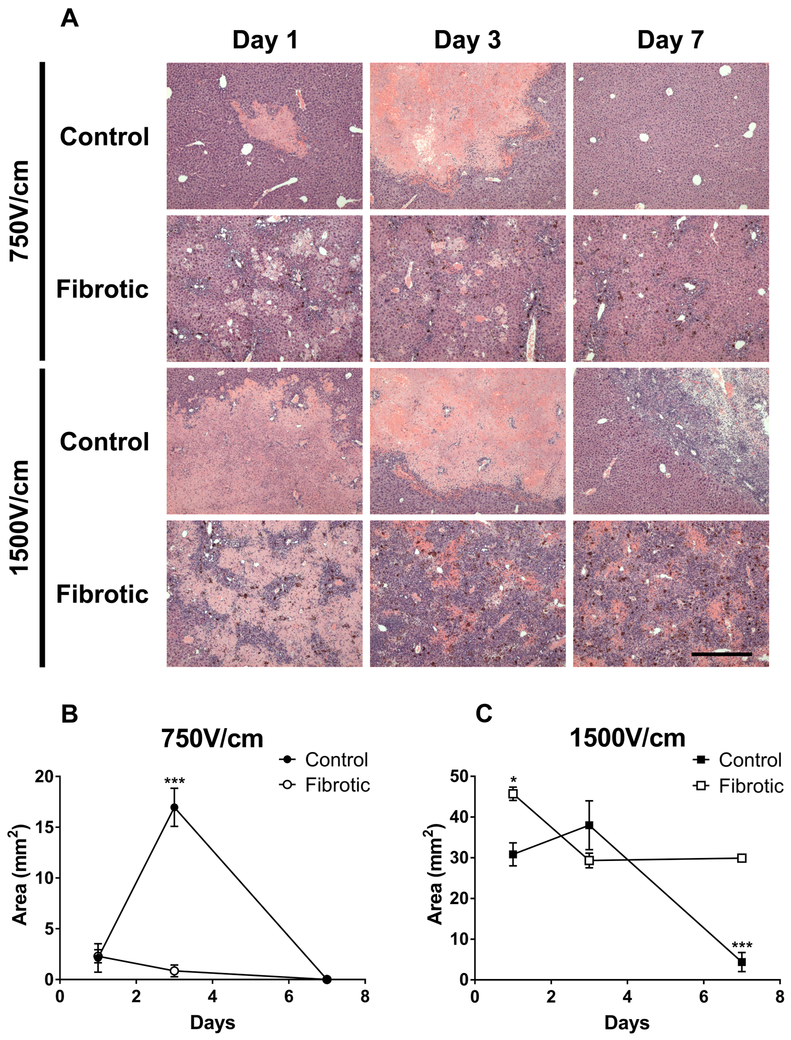
Figure 4. Patterns of cell death and inflammation after IRE treatment are different in fibrotic liver compared to control liver.
(A) Histology of control and fibrotic liver was examined by H&E staining on days 1, 3, and 7 after 750V/cm or 1500V/cm IRE treatment. Histology shows recovery of both control and fibrotic liver to baseline tissue architecture by 7 days after 750V/cm IRE. Control liver shows partial recovery of normal liver parenchyma at 7 days after 1500V/cm IRE. In contrast, fibrotic liver demonstrates persistent and severe inflammatory infiltrates at 7 days after 1500V/cm IRE. Magnification 4x. Scale bar = 500μm for all images. (B) Injury area size after 750V/cm IRE treatment in control and fibrotic liver. (C) Injury area size after 1500V/cm IRE treatment in control and fibrotic liver. Measured injury areas include areas of cell death and associated inflammatory infiltration. Histology images (A) are representative of 3-5 mice at each timepoint for each group (n=3-5), with the exception of “day 1-fibrotic liver-1500V/cm” for which n=2. Injury area data (B-C) represent the average injury area for each group at each timepoint, with error bars showing SEM. Asterisks show the timepoints in which injury area was significantly different between control and fibrotic liver. *p<0.05, ***p<0.001 by Student’s t-test.

