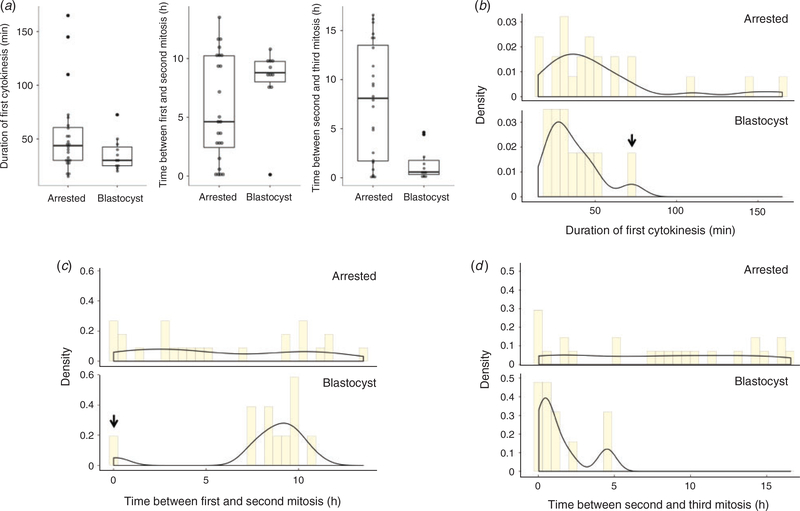
Fig. 3.
Arrested equine embryos exhibit highly variable mitotic timing compared with blastocysts. (a) Box and whisker plots of the time intervals between the first three mitotic divisions in arrested cleavage stage embryos and blastocysts show stricter mitotic timing in embryos that successfully developed to the blastocyst stage. The boxes show the interquartile range, with the median value indicated by the horizontal line; whiskers show the range. Individual symbols show outliers. (b–d) Analysis of the variance in the duration of the first cytokinesis (b) and the time between the first and second mitotic division (c) and the second and third mitosis (d) revealed highly variable early mitotic timing in arrested embryos compared with blastocysts. Columns show the density, with the solid lines indicating trends. Note that the one outlier in the blastocyst group (black arrows in (b) and (c)) was the same embryo for the first two divisions.

