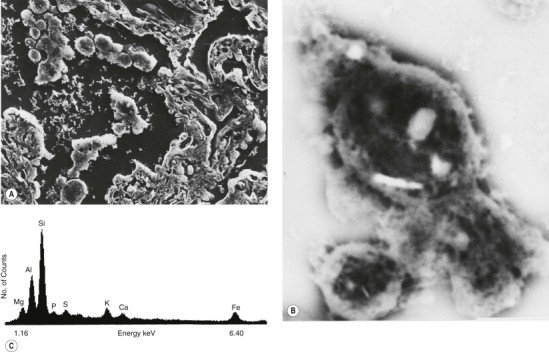
Figure 7.1.6.

Dust particles in the lung: electron microprobe analysis. (A) The secondary (scanning) electron microscopic image of a deparaffinised 5-µm-thick section of lung showing clumps of macrophages in an alveolar lumen. (B) Back-scattered scanning electron microscopic image showing three of the macrophages at higher power: several bright particles worthy of further attention are evident. (C) X-ray energy spectrum of one of the particles showing it to be a silicate. The section had been transferred from a glass to a Perspex slide to avoid background signals, glass being siliceous. Each element emits a unique energy pattern when bombarded by electrons while the number of counts is in proportion to the amount of the particular element that is present in the particle.
(Courtesy of Professor DA Levison, Dundee, UK.)
