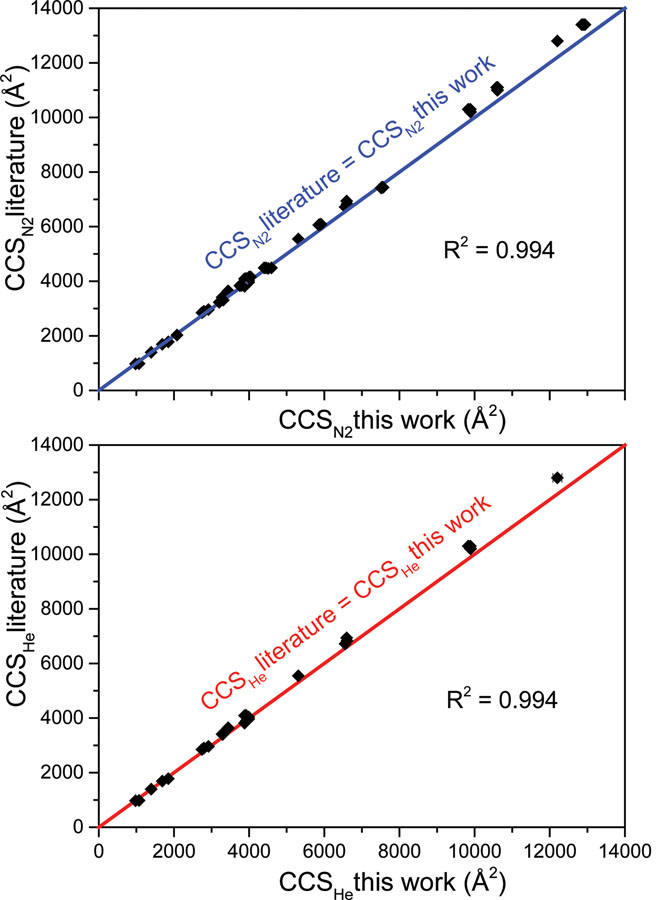
Figure 2.
Comparison of CCS values from “normal charge” ammonium acetate experiments in this work with numerous literature values using comparable solution conditions6,35,36 (from Waters Synapt DTIMS and Agilent 6560 DTIMS platforms; most in He drift gas) in (A) nitrogen drift gas and (B) helium drift gas. The colored linear fit line in each plot represents perfect agreement between the datasets and data points fit to these lines have high R2 values in each case. Error bars on CCS values from this work are shown but typically remain within the data point size.

