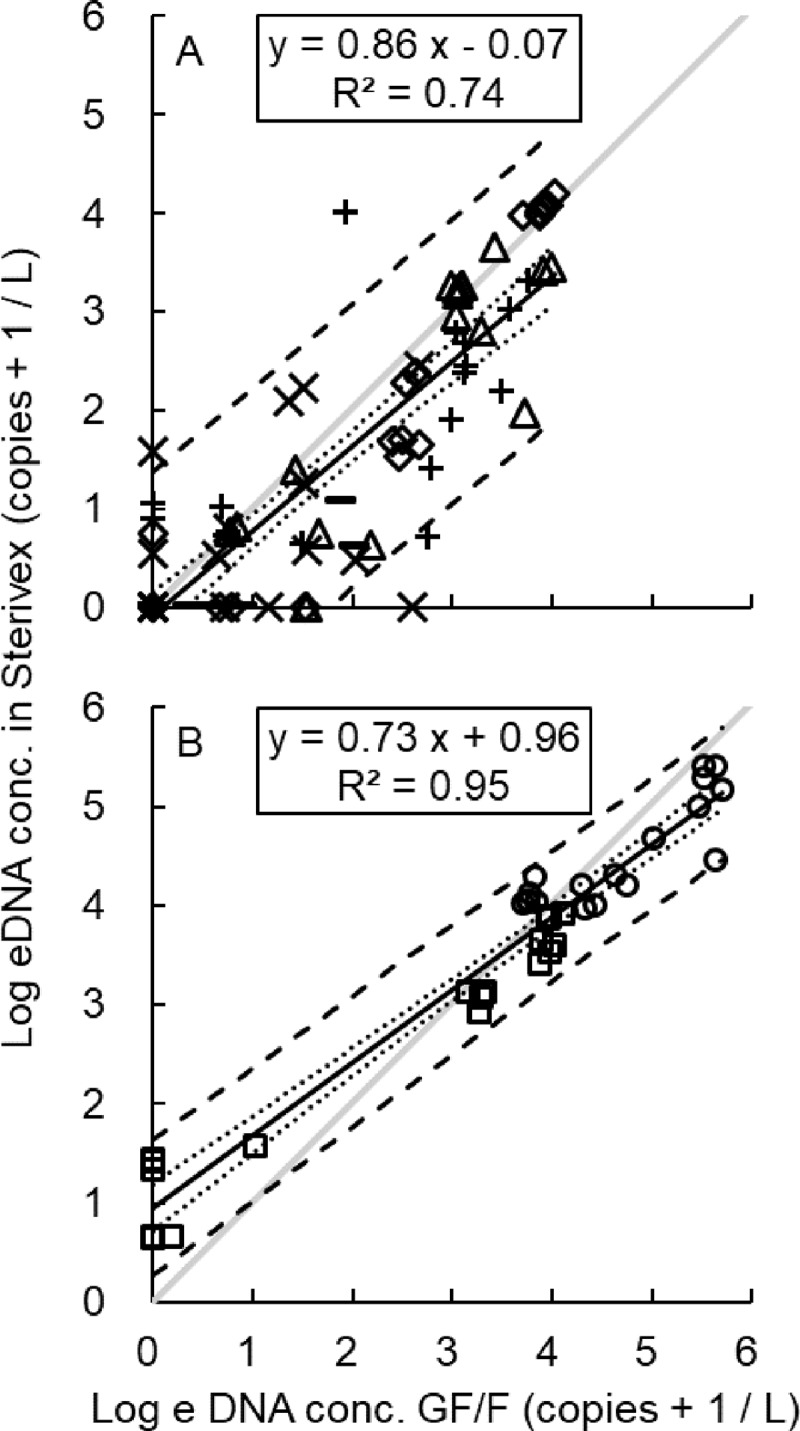
Fig 4.

Correlation of eDNA concentration estimated by two different filtration methods (GF/F and Sterivex) in fish (A) and jellyfish (B). (A) fish, △: Acanthopagrus schlegelii, ◇: Engraulis japonicus, ×: Halichoeres tenuispinnis, −: Oplegnathus fasciatus, +: Trachurus japonicus, (B) jellyfish, ○: Aurelia aurita, □: Chrysaora pacifica, dotted lines: the 95% confidence limits, dashed lines: the 95% prediction limits, gray lines: y = x.
