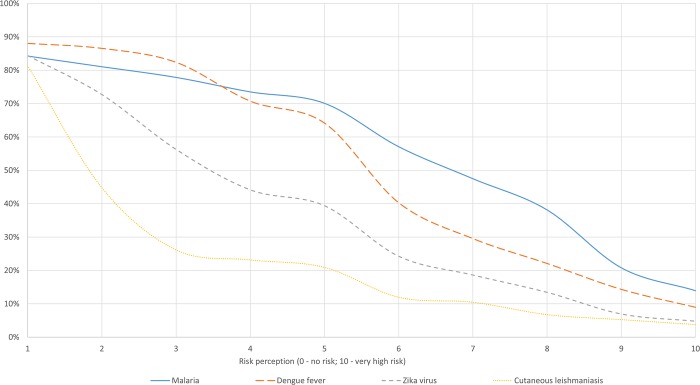
Fig 3. Cumulative frequency of self-reported risk perception across diseases.
As this graph shows the cumulative frequency of risk perception, we start by including the people who had a risk perception of at least 1 (on a scale from 0 to 10). The percentage of people who had a risk perception of 0 can be computed for each disease by subtracting to the sample the proportion of people who perceived a risk of at least 1. For instance, for malaria, 100%-84% = 16% of the sample believed the risk to be 0 (although knowing about the disease).

