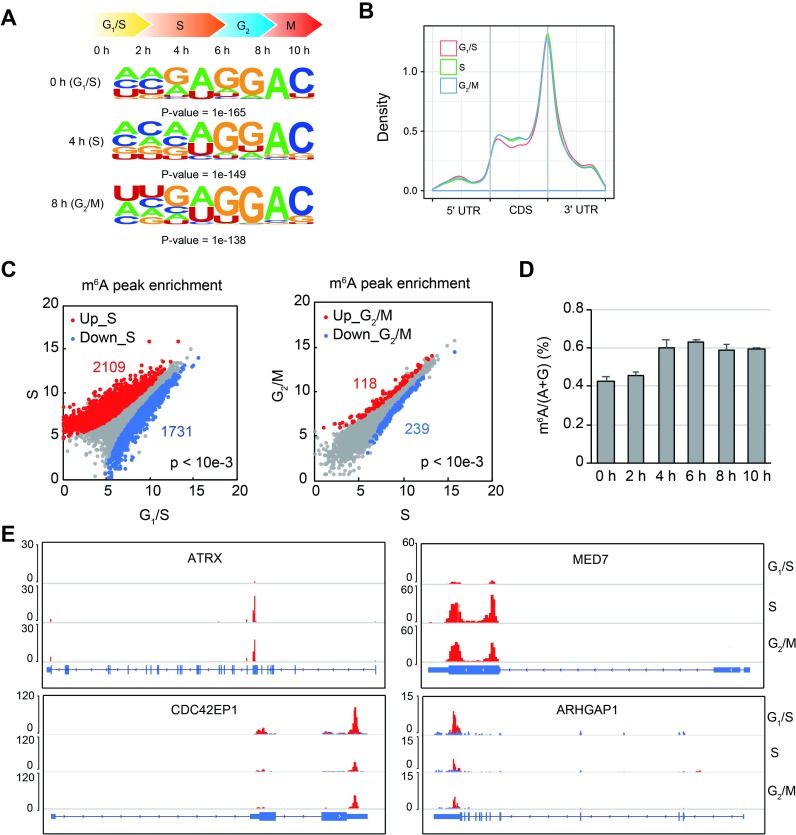
Fig 1. Dynamic transcriptomic m6A changes during cell cycle.
(A) Enriched RNA motifs from the m6A MeRIP-seq data from cells at different phases of cell cycle. (B) Metagene analysis of m6A peak distribution on mRNAs. (C) Differential m6A enrichment analysis across G1/S, S, and G2/M phases of cell cycle. (D) The m6A levels of mRNA quantified by LC-MS/MS at different time points post G1/S synchronization. y-Axis indicates the ratio of m6A to the sum of A and G. (E) Examples of genes with dynamic m6A modification on mRNAs. ATRX and MED7 m6A peak enrichment increases at S phase compared with G1/S and are related to DNA duplex unwinding and Pol II transcription, respectively. m6A peak enrichment of CDC42EP1 and ARHGAP1 reduces at S phase, which are related to Rho protein signaling or GTPase activity. Blue and red bars indicate the input and IP read coverages, respectively. Underlying data for this figure can be found in S1 Data. ARHGAP1, Rho GTPase Activating Protein 1; ATRX, alpha thalassemia/mental retardation syndrome X-linked; CDC42EP1, CDC42 Effector Protein 1; CDS, coding sequence; IP, immunoprecipitation; LC-MS/MS, liquid chromatography–tandem mass spectrometry; MED7, Mediator Complex Subunit 7; m6A, N6-methyladenosine; MeRIP-seq, methylated RNA immunoprecipitation sequencing; Pol II, RNA polymerase II; UTR, untranslated region.

