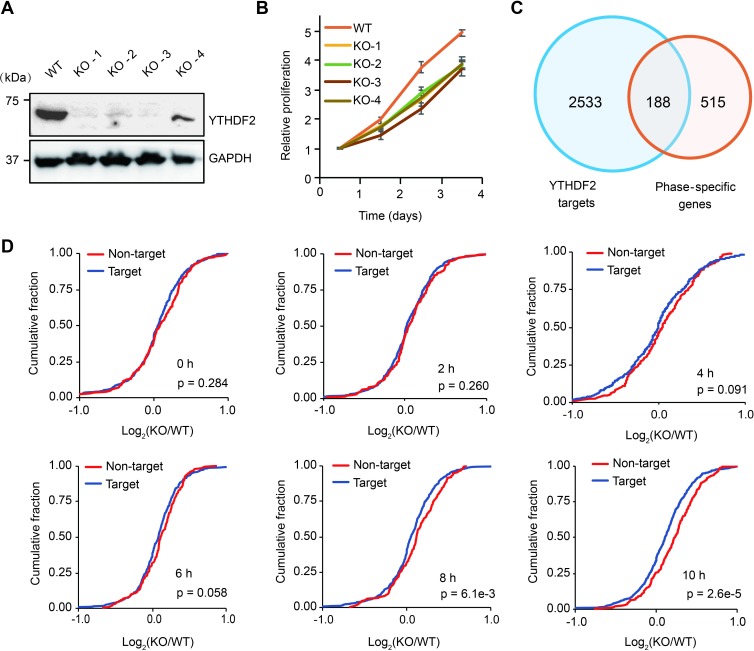
Fig 2. YTHDF2 depletion delays cell proliferation and elevates target transcripts.
(A) Western blot of YTHDF2 in CRISPR-Cas9 KO cell lines. (B) Cell proliferation assays of WT and YTHDF2 KO cell lines. (C) Intersection of genes that are confident YTHDF2 targets and the ones that are phase specific. (D) Cumulative distribution of phase-specific transcripts that are YTHDF2 bound (188 genes, in red) and unbound (515 genes, in blue) by comparing WT and KO cell lines. The x-axes indicate the log2 fold change of gene expression in KO versus WT. P values were calculated using the Mann-Whitney test. Underlying data for this figure can be found in S1 Raw Images and S1 Data. GAPDH, glyceraldehyde 3-phosphate dehydrogenase; KO, knockout; WT, wild type; YTHDF2, YTH N6-methyladenosine RNA binding protein 2.

