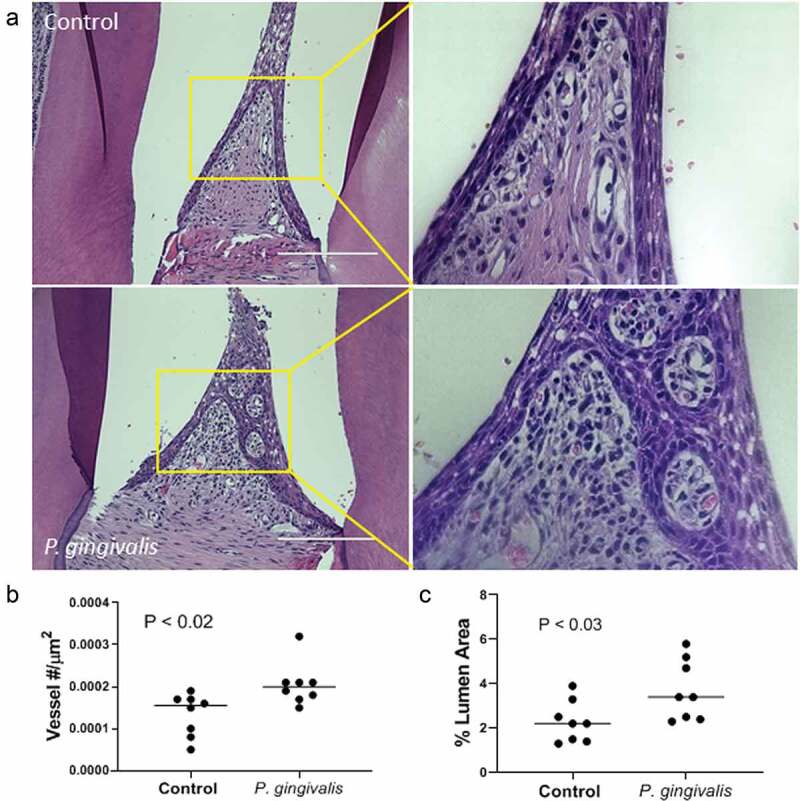
Figure 1.

P. gingivalis-induced changes in rat interdental papillae. (a) Representative H & E stained tissue sections from sham control and P. gingivalis inoculated animals. Panels to the right of each image are magnified images of the boxed region. Scale bars = 200 μm. (b) Subgingival microvascular density expressed as vessel number/tissue area (μm2), and (c) microvascular dilatation (total vessel lumen area/tissue area)
