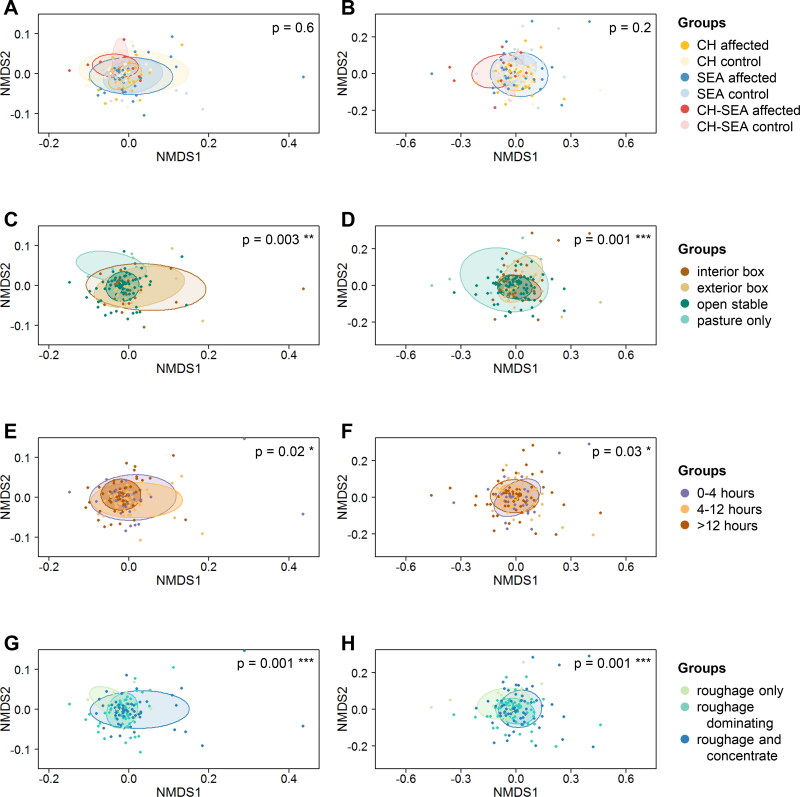
Figure 2.
Nonmetric multidimensional scaling (NMDS) plots. The plots are based on the weighted (left side) and unweighted (right side) Bray-Curtis dissimilarity distance matrices. A and B: Comparisons of study groups (CH = Culicoides hypersensitivity, SEA = severe equine asthma). C and D: Comparisons of stable types. E and F: Comparisons of pasture access rates. G and H: Comparisons of feeding types.

