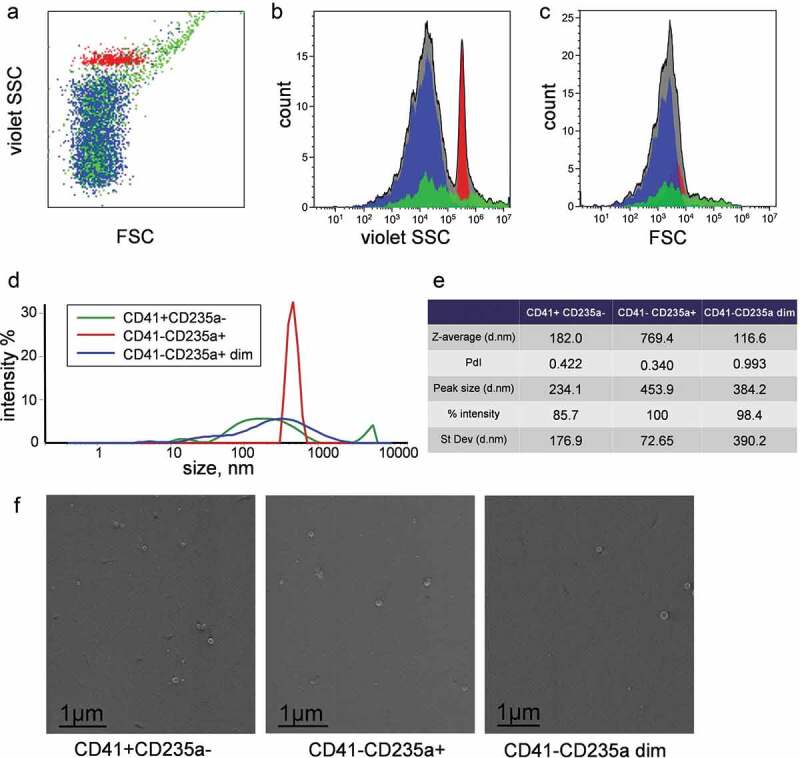
Figure 6.

Characterization of vesicle subpopulations in P16 fraction and sorted samples. (a) Dot plot of side scatter versus forward scatter intensity of vesicles subpopulation in P16 fraction. (b) Corresponding violet SSC intensity histogram. (c) Corresponding FSC intensity histogram. CD41-CD235a+ is highlighted in red, CD41+ CD235a- in green, CD41-CD235a dim in blue. (a, b, c) Subfigures demonstrate data obtained using Cytoflex S cytometer. (d) Plot of size distributions of objects in sorted subpopulations and (e) values of corresponding parameters determined by DLS. (f). Visualization of nanosized objects in sorted subpopulations using low-voltage scanning electron microscopy.
