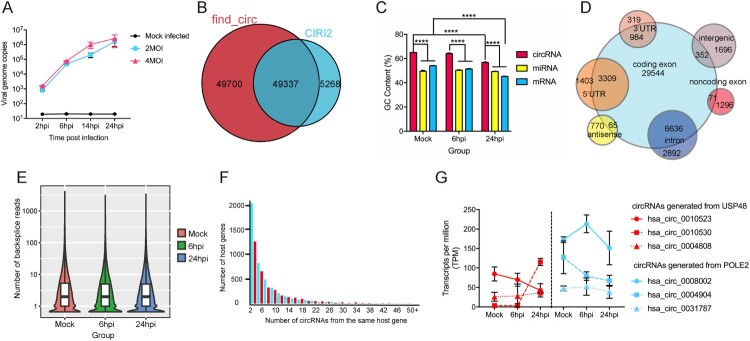
Figure 2.
Characterization of identified circRNAs, miRNAs and mRNAs in MERS-CoV infected and uninfected Calu-3 cells. (A) qRT-PCR results measuring MERS-CoV nucleocapsid gene copies at the indicated time points. Calu-3 cells were either mock-infected or infected with MERS-CoV at MOIs of 2 and 4. All experiments were carried out in triplicates. (B) Venn diagram showing the overlapped circRNAs identified by CIRI2 and find_circ pipelines. (C) Average GC contents of circRNAs, miRNAs and mRNAs. (D) Genomic distribution of circRNAs identified in Calu-3 cells. (E) Violin plot with the Y-axis showing the distribution of the number of back-splicing reads detected in each circRNA at the three time points indicated in the X-axis. (F) Number of circRNA isoforms derived from the same gene. (G) The diversified expression patterns of circRNAs of USP48 and POLE2. Data in A, C, and G represented means and standard deviations.

