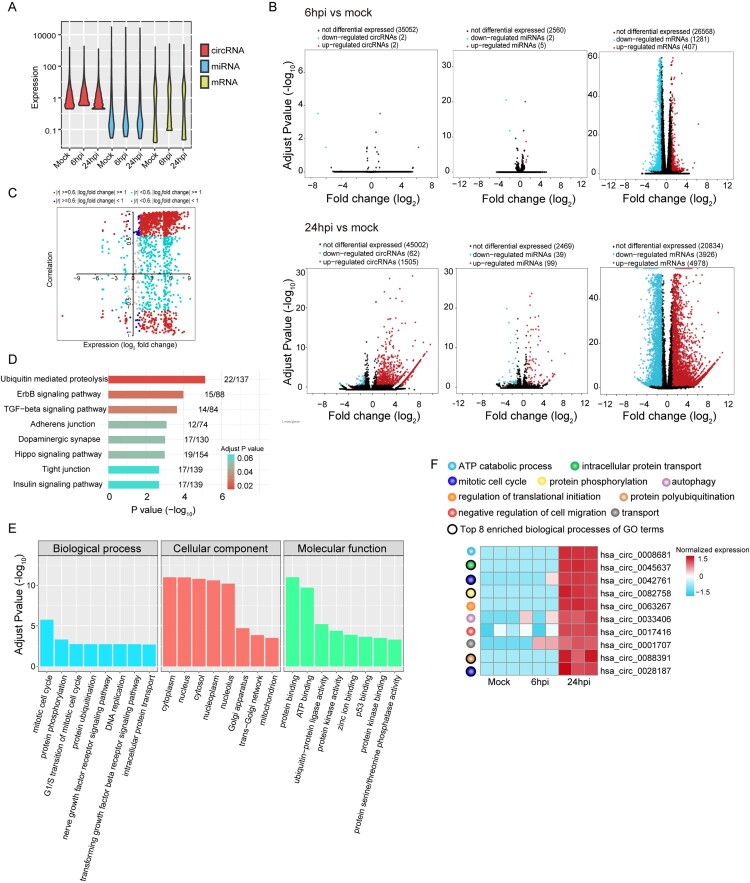
Figure 3.
Global changes on host ceRNAs expression induced upon MERS-CoV infection. (A) Violin plot showing the expression intensity of circRNAs, miRNAs and mRNAs of MERS-CoV infected and non-infected Calu-3 cells. (B) Volcano plots representation of DE circRNA, miRNA and mRNAs identified (up: 6hpi vs mock; bottom: 24hpi vs mock). The selection criteria was set as |log2 (fold change)| ≥1 and adjust P value < 0.05. (C) Correlation between DE circRNAs and their corresponding host genes. DE circRNAs were coloured by Pearson correlation coefficient (r) and their expression at 24hpi. (D, E) Bar plot of the top 8 most enriched KEGG pathways and GO terms of the DE circRNA host genes. (F) Heatmap showing the normalized log2 [expression values in transcripts per million (TPM)] of the top 10 up-regulated circRNAs identified at 24hpi each annotated with the assigned biological process.

