Figure 6.
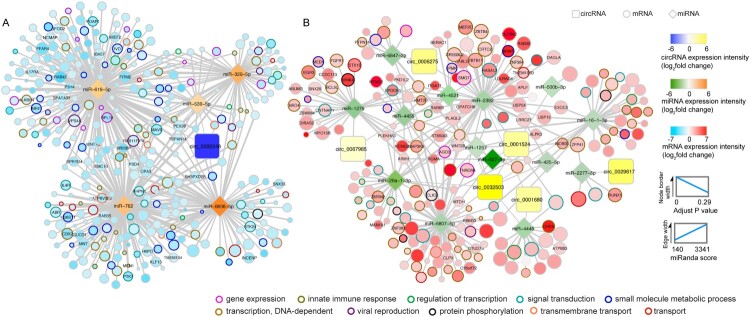
Potential viral pathogenic circRNAs in the ceRNA co-regulatory network. circRNAs, miRNAs, and mRNAs potentially involved in MERS-CoV pathogenesis were represented by triangle, rectangle, and circle nodes, respectively. The border thickness and filling colour of each node were mapped according to the expression and adjust P value of each RNA at 24 h post MERS-CoV infection. The size of mRNAs was proportional to their correlation extent with selected circRNAs. The stronger that correlation, the larger the node. Top 10 overrepresented GO terms were adopted to colour the border of mRNAs identified in the interactome, and the mRNAs strongly correlated with miRNAs (r < −0.85, cP < 0.05) and circRNAs (r > 0.85, cP < 0.05) simultaneously were labelled with name. Edge thickness was proportionally correlated with the predicted interaction between each circRNA-miRNA pair and miRNA-mRNA pair as defined by miRanda. Among the 6 circRNAs which were significantly upregulated, circ_0006275 and circ_0067985 were selected for further validation. The expression levels of circ_0032503, and the target miRNA of circ_0001680 and circ_0001524 were low, and were therefore not suitable for siRNA knockdown experiment. circ_0029617 only interacted with 1 miRNA and was therefore not selected for further validation.

