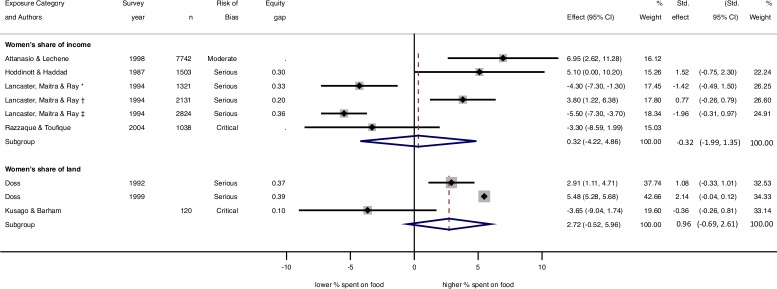
Figure 2.
Forest plot of effects of women’s share of household income and women’s share of household land on percentage share of household expenditures spent on food. Weights are from random-effects models. Equity gap was calculated as the difference between perfect equity (0.5) and women’s proportion of income or land. I2 for women’s share of income=91.7% unstandardised effects; 94.2% standardised effects. I2 for women’s share of land=89.3% unstandardised effects; 97.8% standardised effects. *, rural Kerala; †, rural Maharashtra; ‡, rural Bihar; Std., standardised.

