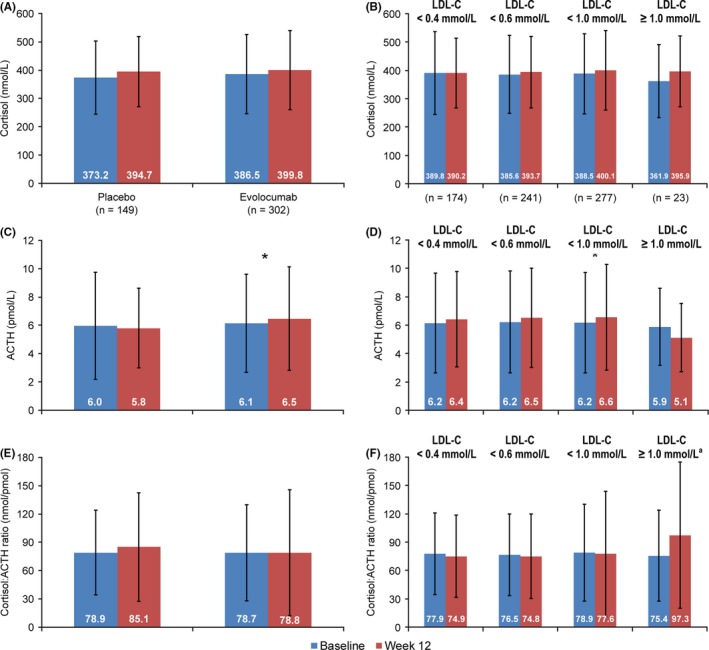
Figure 3.

Mean (SD) Cortisol Levels, ACTH Levels and Cortisol:ACTH Ratio in the Chinese Population at Baseline and Week 12 and by Minimum Postbaseline LDL‐C. A, Cortisol levels; B, cortisol levels in the evolocumab group. C, ACTH levels; D, ACTH levels in the evolocumab group; E, cortisol:ACTH ratio; F, cortisol:ACTH ratio in the evolocumab group. ACTH, adrenocorticotropic hormone; LDL‐C, low‐density lipoprotein‐cholesterol; SD, standard deviation. *P = .02; P‐values (paired t test) are nonsignificant unless given above the comparison. aDue to abnormal distribution of the data in this group, the Wilcoxon signed‐rank test was also used in addition to the paired t test. The result (P = .06) confirmed the lack of a statistically significant difference
