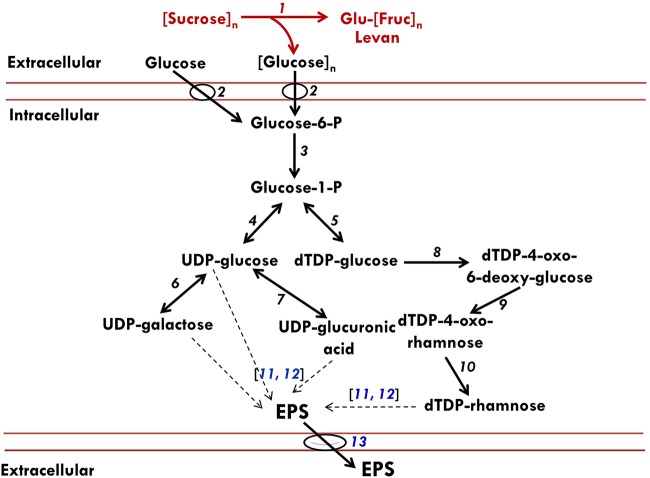
FIG 6.
Schematic representation of likely pathways for EPS production by P. polymyxa. The diagram was conceived based on the results of our enzymatic assays, qRT-PCR data, and annotated metabolic network model of P. polymyxa on the Kyoto Encyclopedia of Genes and Genomes (KEGG) database. The red and black fonts or lines represent annotated and putative EPS pathways in P. polymyxa, respectively. 1, Levansucrase; 2, sugar PTS; 3, phosphoglucomutase; 4, UTP-glucose-1-phosphate uridylyltransferase; 5, glucose-1-phosphate thymidylyltransferase; 6, galactose-1-phosphate uridylyltransferase; 7, UDP-glucose-6-dehydrogenase; 8, dTDP-glucose-4,6-dehydratase; 9, dTDP-4-dehydrorhamnose-3,5-epimerase; 10, dTDP-4-dehydrorhamnose reductase; 11, polymerase synthase; 12, exopolysaccharide biosynthesis protein; 13, flippase. The dashed black arrows represent steps in EPS polymerization from nucleotide sugars. The genes that code for enzymes (numbers 11, 12, and 13) in blue font were analyzed by qRT-PCR.

