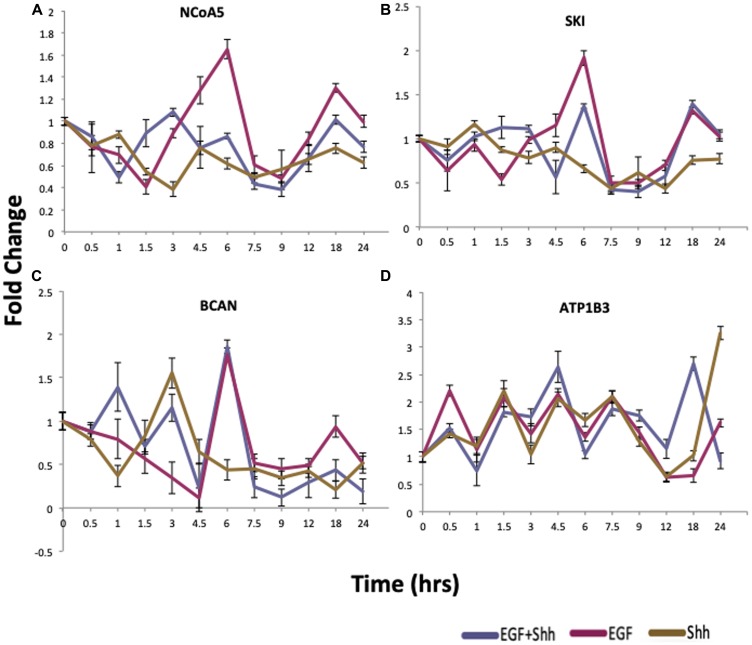
Figure 5. qRT-PCR validation of proposed cross-talk genes.
qRT-PCR results of cells treated with EGF (purple), Shh-N conditioned media (gold), or a combinational treatment with Shh-N and EGF (blue). Panels (A–C) show that EGF dominates the effects of SHH in EGF+SHH treatment after a certain point. Panel (D) shows the effect of co-activation, where under EGF+SHH treatment behavior diverges form that under EGF or SHH at and after 12 hours. n = 3/group, and data are expressed as mean ± SEM.

