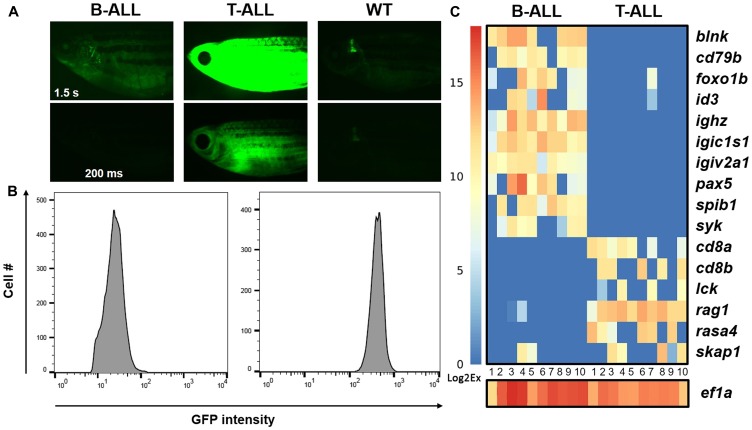
Figure 4. Gene expression in individual hMYC B- and T-ALL cells.
(A) rag2:hMYC;lck: GFP fish with dim (left) and bright (center) cancers. B-ALL is only visible with 1.5 s exposure (upper left); T-ALL is visible with either 1.5 s (upper middle) or 200 ms (lower middle) exposures. Control lck:GFP fish images are shown at right, where only the thymus is visible. (B) Flow cytometry plots of the same ALL samples demonstrate GFPlo B-ALL and GFPhi T-ALL specimens. (C) Gene expression in single B- and T-ALL cells of the same cancers (n = 10 cells for each), as determined by Fluidigm™ Biomark qRT-PCR. B-ALL cells express B cell, but not T cell, genes; T-ALL show the opposite pattern. Expression of eef1a1l1 (homologue of human eukaryotic translation elongation factor 1 alpha 1, aka EF1A) was used as a threshold control for the presence of RNA in each well. CT values were converted to Log2Ex for visualization (scale bar at left).

