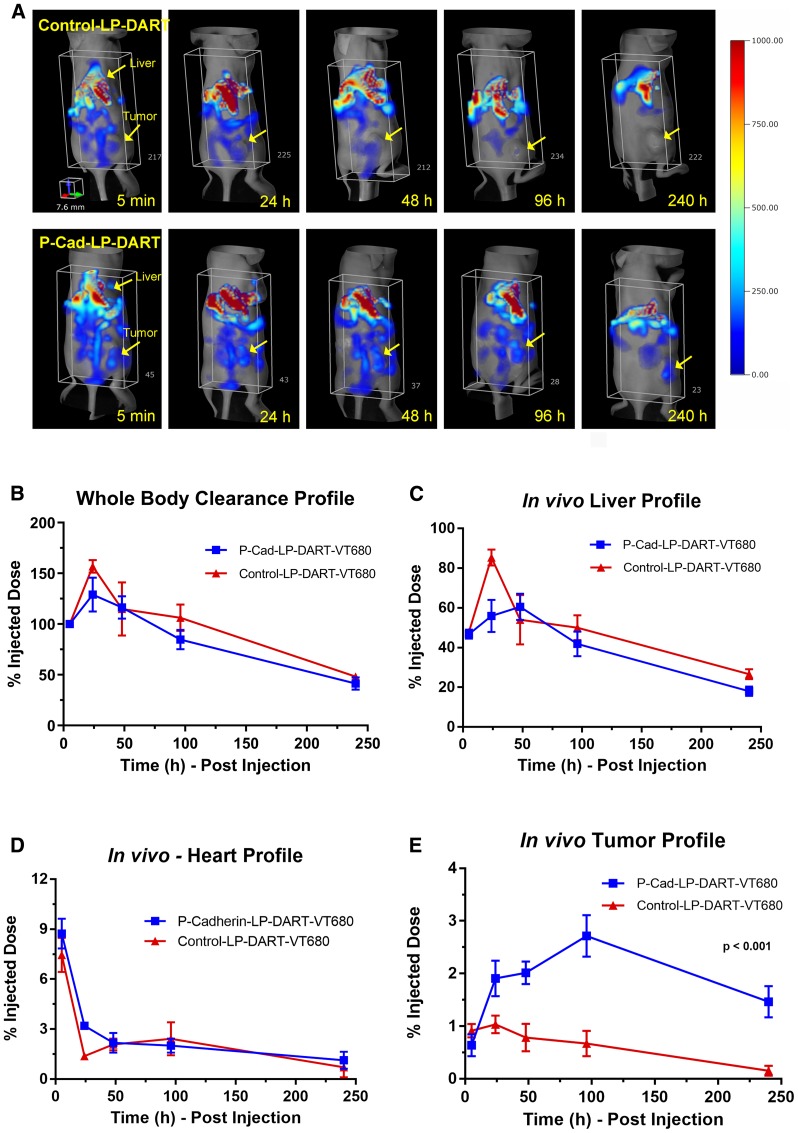
Figure 3. In vivo biodistribution and tumor targeting profile of P-cadherin LP-DART-VT680 and Control LP-DART-VT680.
Female nu/nu mice bearing HCT116 xenografts were injected intravenously with P-cadherin LP-DART-VT680 and Control LP-DART-VT680 at doses equivalent to 1 nmol of VT680 (~1.4 mg/kg). FMT imaging was performed using the 680 laser at 5 min, 24, 48, 96 and 240 hr post-injection. (A) Representative 3-dimentional FMT images showing the whole-body (torso) biodistribution of P-cadherin LP-DART-VT680 and Control LP-DART-VT680. Arrows indicate the location of tumor and liver. (B) Relative whole-body profile of P-cadherin LP-DART-VT680 and Control LP-DART-VT680. (C) Relative liver profile of P-cadherin LP-DART-VT680 and Control LP-DART-VT680. (D) Upper torso was imaged separately to image heart and brain region. Relative heart profile of P-cadherin LP-DART-VT680 and Control LP-DART-VT680 shows a biphasic clearance profile. (E) Relative tumor accumulation of P-cadherin LP-DART-VT680 and Control LP-DART-VT680. No major difference was observed between P-cadherin LP-DART-VT680 and Control LP-DART-VT680 in the profiles of whole-body, liver, and heart. Tumor profile showed a significantly increased accumulation of P-cadherin LP-DART-VT680 compared to Control LP-DART-VT680. n = 4–6/group; ± SEM is represented in the graphs; Tumor accumulation: p value < 0.001, 2-way ANOVA.

