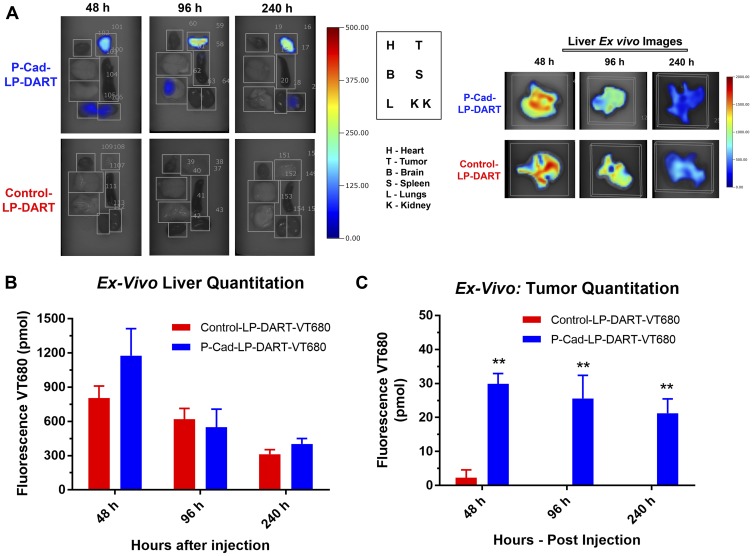
Figure 4. Ex vivo imaging and quantitation of accumulation in tumor and other organs.
(A) Ex vivo FMT imaging panel showing the accumulation of P-cadherin LP-DART-VT680 and Control LP-DART-VT680 at 48, 96 and 240 hr in various organs: Tumor (T), Heart (H), Brain (B), Spleen (S), Lungs (L), Kidneys (K). No notable signal observed from any organs in this image except for tumor. Liver was imaged as a separate panel due to its size and was quantified. (B) Ex vivo quantitation of liver: No significant differences in liver was observed between P-cadherin LP-DART-VT680 and Control LP-DART-VT680 at 48, 96 and 240 hr. (C) Ex vivo quantitation of tumor showed significantly increased accumulation of P-cadherin LP-DART-VT680 compared to Control LP-DART-VT680 at 48, 96 and 240 hr. n = 3–4/group; ± SEM is represented in the graphs; ** = p value < 0.01.

