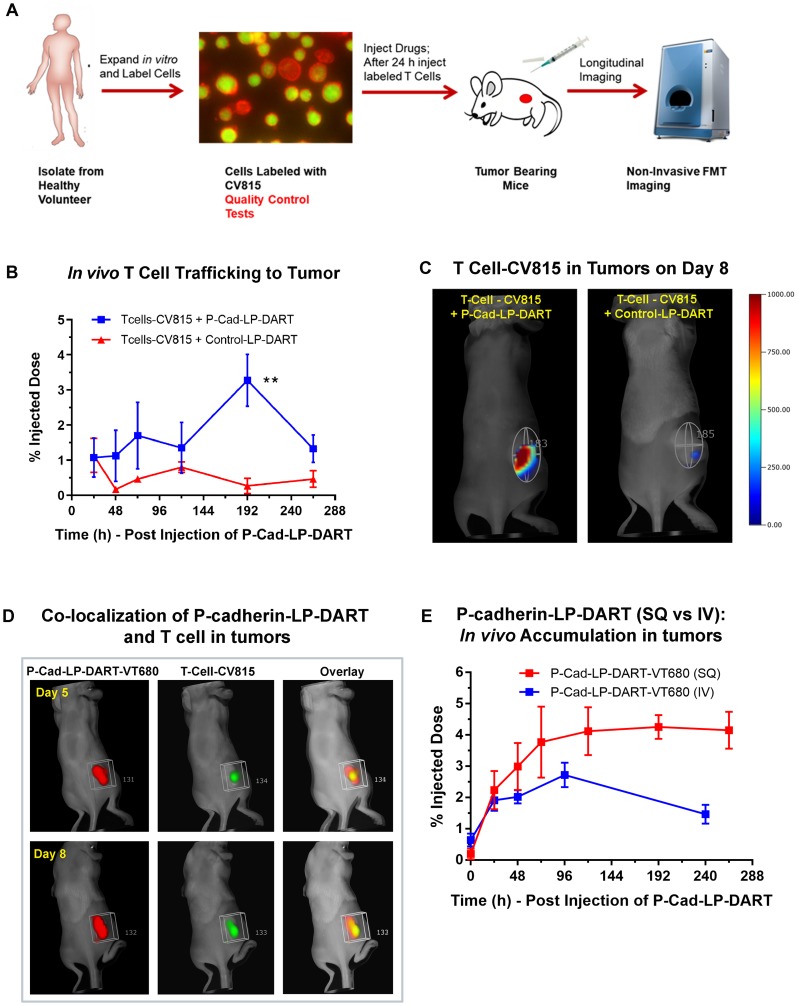
Figure 6. In vivo T cell trafficking in HCT-116 xenograft model by FMT imaging.
Female NSG mice bearing HCT116 xenografts were injected subcutaneously with P-cadherin LP-DART, P-cadherin LP-DART-VT680 or Control LP-DART at 2 mg/kg dose. After 24 hr the CV815-T cells (5 × 10⁶ cells) were injected intravenously. FMT imaging was performed longitudinally using the 680 nm laser for VT680 and the 800 nm laser for CV815. (A) Schematic showcasing the design of T cell trafficking study. (B) Profile of in vivo tumor trafficking of CV815-T-Cells in groups treated with unlabeled P-cadherin LP-DART and Control LP-DART. No significant difference of CV815-T-Cells was observed in until 120 hr post-injection. At 192 hr there was a significant increase in CV815 signal in tumors (n = 3–4/group; ± SEM is represented at all time points; t-test, ** p-value < 0.01). (C) FMT images on day 8 (192 hr) showing the CV815-T cells in tumor of mice treated with unlabeled P-cadherin LP-DART whereas minimal signal was observed in Control LP-DART treated mice. (D) Representative FMT images on day 5 and 8 from a separate cohort of animals showing co-localization of P-cadherin LP-DART-VT680 (red) with CV815-T cells (green). (E) Comparison of profiles of tumor accumulation when P-cadherin LP-DART-VT680 was administered via intravenous route (IV) and subcutaneous route (SQ). FMT profile shows a slower, sustained and a slightly increased P-cadherin LP-DART-VT680 accumulation by subcutaneous administration.

