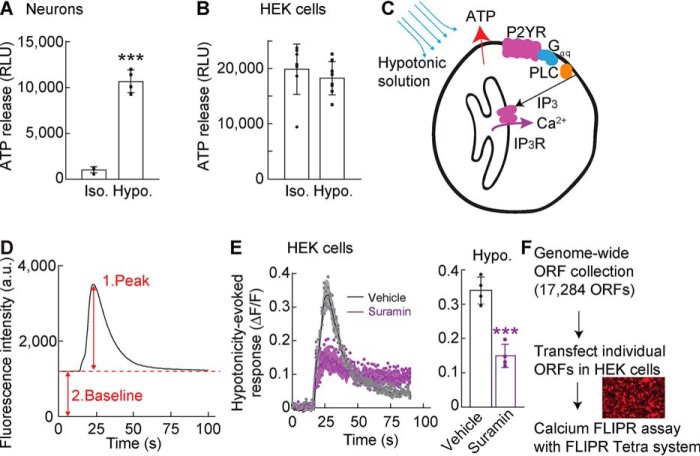
Figure 1.
Establishing a screening platform for ATP release machinery. A and B, cerebellar granule neurons (A) or HEK cells (B) were plated and stimulated with conditioned HEPES-buffered saline (isotonic 330–340 mmol/kg; Iso.) or hypotonic solution (final concentration, 250 mmol/kg; Hypo.). Hypotonic stimulation increased ATP released from primary cerebellar neurons (n = 4) but not HEK cells (n = 8) relative to isotonic stimulation. RLU, relative luminescent unit. C, schematic diagram of hypotonic activation of Gq-coupled P2YR signaling in HEK cells. D, calcium responses using the calcium FLIPR assay. Each trace was analyzed by measuring a peak (1) response normalized to its baseline (2) response (ΔF/F). E, hypotonicity-induced calcium responses were measured with the calcium FLIPR assay in HEK cells preincubated without (vehicle) or with a P2 receptor antagonist, 300 μm suramin, for 15 min; traces and quantification of peak calcium response (ΔF/F) with error bars are shown (n = 4). F, overview of the GOF screen with a genome-wide ORF collection to identify modulators of hypotonicity-induced ATP release. The genome-wide ORF collection, including 17,284 nonredundant ORFs, was generated (see details under “Experimental procedures”). Each ORF was transfected transiently into HEK cells, followed by measurements of fluorescence intensity from each well using the calcium FLIPR assay. The data are means ± standard deviation; unpaired t test (A and E). ***, p < 0.001.

