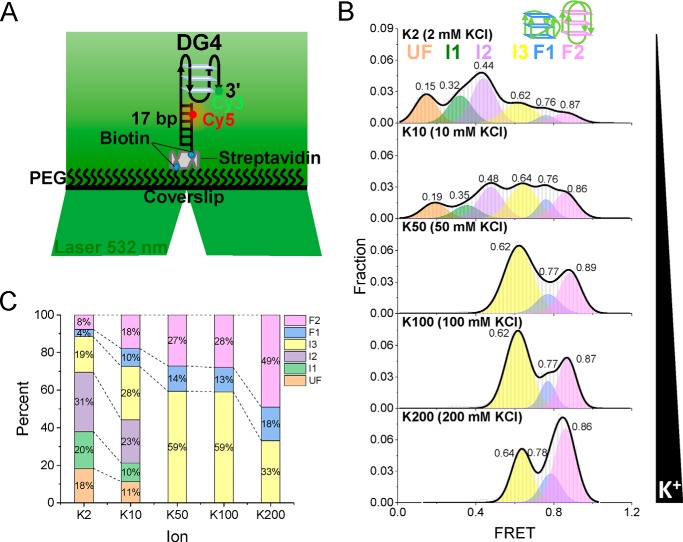
Figure 3.
Six states of pTG4 in K+ are distinguished from FRET. A, schematic view of the smFRET assay. The pTG4 containing overhang DNA was Cy3-labeled (green) and Cy5-labeled (red). A 532-nm laser was used to light up Cy3. Biotin was used for immobilization. B, FRET histograms for different concentrations of K+. Multipeak Gaussian distributions were used to fit those histograms. C, the fractions of the different folding structures at increasing concentrations of K+.

