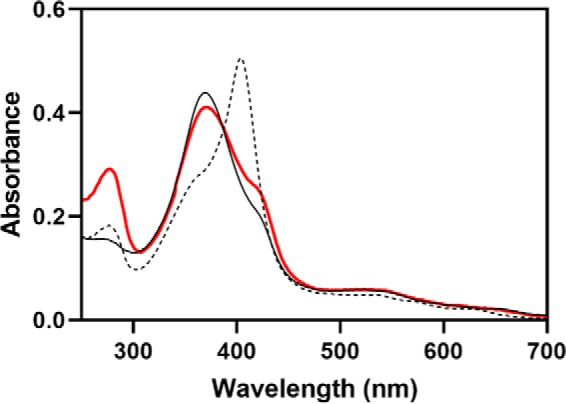
Figure 2.

Characterization of the H45W/G159W variant of HO2. The absorbance spectrum of TCEP-reduced H45W/G159W HO2solR incubated with Fe3+-heme and separated from unbound heme is shown in red. The spectrum is of 5 μm protein in 50 mm Tris (pH 8.0), 50 mm KCl buffer at 20 °C. For comparison, the spectra of WT HO2tail, which binds heme at both the Cys265/His256 (HRM1) and Cys282 (HRM2) sites (solid black), and WT HO2solO, which binds heme at the core with His45 (dashed black), are shown.
