Figure 3.
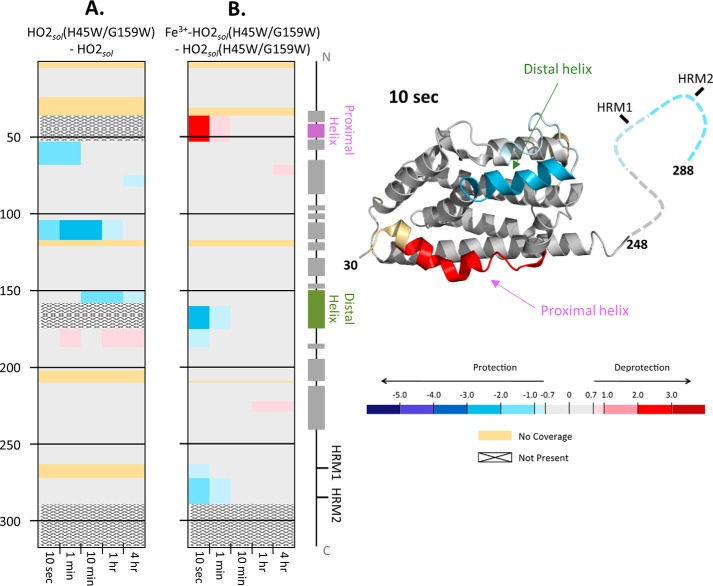
HDX-MS comparisons of HO2sol. A, differences in deuterium incorporation between the apo states of the H45W/G159W variant and WT HO2sol. The differences in deuterium level are shown for labeling times 10 s, 1 min, 10 min, 1 h, and 4 h (left to right of each graph). In each panel, the peptic peptides where deuterium was measured are arranged N- to C-terminally (top to bottom), with approximate sequence numbering on the left side. Deuterium differences were calculated using the equation DH45W/G159W − DWT for each comparison and then colored according to the scale shown. A guide to the regions of each protein is shown at the far right. All data used to create this figure can be found in supporting Excel File S1. B, differences in deuterium incorporation between the heme-bound, TCEP-reduced state and the apo state of the H45W/G159W variant of HO2sol. Deuterium differences were calculated using the equation Dheme − Dapo for each comparison and then colored according to the scale shown C, mapping the data from the 10-s differences in B onto the structure for HO2 (Protein Data Bank code 2RGZ).

