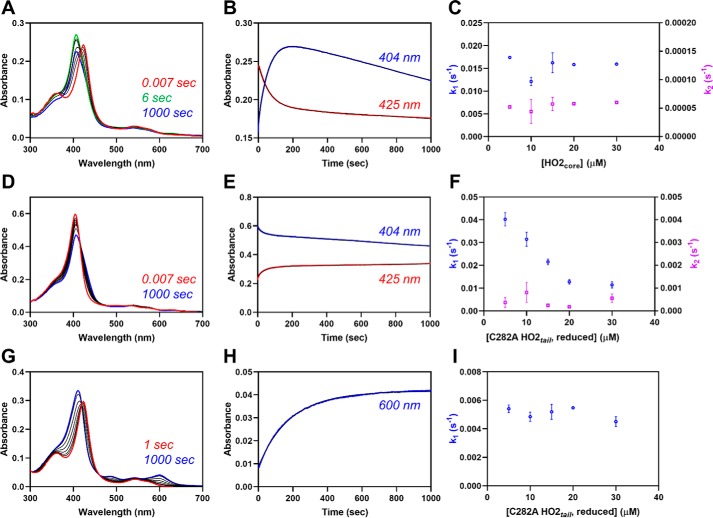
Figure 4.
Fe3+-heme transfer or exchange between proteins. A, heme-bound C282A HO2tail (5 μm final concentration) was rapidly mixed with an equimolar concentration of apo-HO2core in a stopped-flow instrument within an anaerobic chamber. The data at 0.007 s (red), 6 s (green), 1000 s (blue), and several representative intermediate time points (black) are shown. All measurements were carried out at 20 °C using the 1-cm path length configuration in photodiode array mode with 2–4 replicates. B, the stopped-flow trace at 404 nm (blue) and 423 nm (red) from one of the replicates is shown. The data were fit to a double-exponential equation (black) using the Pro-data Viewer software provided by Applied Photophysics. C, the experiment described in A was repeated at varying concentrations of apo-HO2core, and the data at 404 nm were treated as described in B by fitting to a double-exponential equation. The rates were plotted as a function of the final concentration of apo-HO2core in the assay with k1 in blue on the left y axis and k2 in orange on the right y axis. Data represent the average ± S.D. (error bars) of 2–4 acquisitions. D–F, same as A–C except that heme-bound apo-HO2core was mixed with varying concentrations of C282A HO2tail. G–I, same as A except that heme-bound C282A HO2tail was mixed with varying concentrations of apo-H64Y/V68F-myoglobin (“green heme”), and the data at 600 nm were fit to a single-exponential equation.

