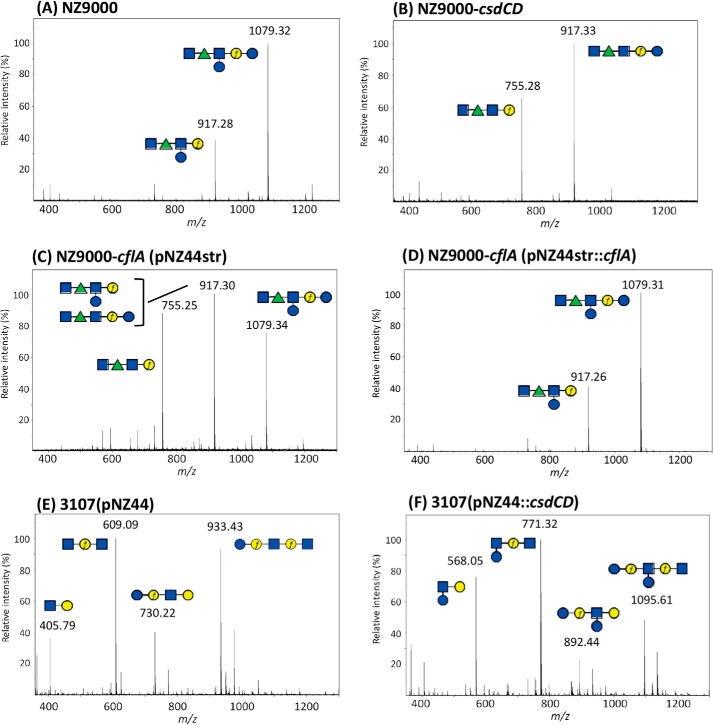
Figure 3.
MALDI-TOF MS spectra obtained on purified PSP oligosaccharides extracted by HF treatment from cell walls of WT L. lactis NZ9000 (A), L. lactis NZ9000-csdCD mutant (B), L. lactis NZ9000-cflA(pNZ44str) flippase mutant (C), L. lactis NZ9000-cflA(pNZ44str::cflA) complemented flippase mutant (D), L. lactis 3107 with empty pNZ44 (E), and L. lactis 3107(pNZ44::csdCD) (F). m/z values on spectra correspond to [M + Na]+ ion adducts. During HF extraction, the polymeric PSP of L. lactis NZ9000 is cleaved at the level of phosphodiester bonds, leading to hexasaccharide (Mcalc 1079.37) and also partially cleaved after Galf, leading to a pentasaccharide (Mcalc 917.32), as shown previously by NMR (9). Similarly, the polymeric PSP of L. lactis 3107 is cleaved during HF extraction at the level of phosphodiester bonds, leading to pentasaccharide (Mcalc 933.32), and also partially after the two Galf present in the structure, leading to fragments with Mcalc of 730.24, 609.21, and 406.13 (for Na+ adducts) (10). Calculated and observed m/z values of the different oligosaccharide structures tentatively assigned to major peaks of the spectra are listed in Table S2. Structures are drawn using the symbol nomenclature for graphical representation of glycans (SNFG). Blue square, GlcNAc; green triangle, Rha; blue circle, Glc; yellow circle, Gal. f, furanose.

