Figure 2.
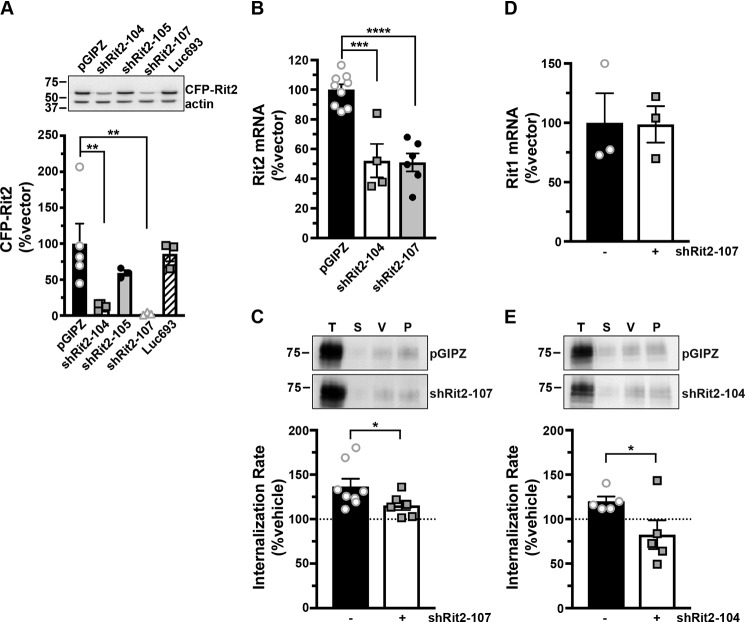
Rit2 is required for PKC-stimulated DAT internalization in DAT-SK-N-DZ cells. A, human Rit2 shRNA screen. Mouse N2a cells were co-transfected with human CFP-Rit2 and either pGIPZ vector, luciferase-293 control, or the indicated Rit2 shRNA-pGIPZ plasmids. Top, representative immunoblots. Bottom, average CFP-Rit2 levels, normalized to actin-loading controls, expressed as percentage of pGIPZ vector ± S.E. (error bars). Asterisks, significant difference from pGIPZ controls (one-way ANOVA F(4, 14) = 6.396, p = 0.004; Dunnett's multiple-comparison test, pGIPZ versus shRit2-104: **, p = 0.005; versus shRit2–105: p = 0.36; versus shRit2-107: **, p = 0.006; versus luc693: p = 0.95, n = 3–5). B, shRit2-mediated knockdown in stable DAT-SK-N-DZ cells. DAT-SK-N-DZ cells were transduced with control, shRit2-104, or shRit2-107 lentiviral particles, and Rit2 mRNA expression was measured by RT-qPCR 96 h post-transduction. Average ΔΔCt values are presented, expressed as percentage of control-transduced values ± S.E. Asterisks, significant difference from pGIPZ controls (one-way ANOVA F(2, 16) = 25.09, p < 0.0001; Dunnett's multiple-comparison test: pGIPZ versus shRit2-104: ***, p = 0.0001; versus shRit2-107: ****, p < 0.0001, n = 4–9). C, DAT internalization assay. Stable DAT-SK-N-DZ cells were transduced with the indicated lentiviral particles, and DAT internalization rates were measured at 96 h post-transduction as described under “Experimental procedures.” Top, representative immunoblots depicting surface DAT expression at t = 0 (T), strip control (S), and internalized DAT during either vehicle (V) or 1 μm PMA (P) treatment. Bottom, average DAT internalization rates expressed as percentage of vehicle-treated control rates ± S.E. *, p = 0.04, one-tailed Student's t test, n = 6–8. D, Rit1 mRNA expression specificity control. DAT-SK-N-DZ cells were transduced with control or shRit2-107 lentiviral particles, and Rit1 expression was measured by RT-qPCR 96 h post-transduction. Average ΔΔCt values are presented, expressed as percentage of control-transduced values ± S.E. shRit2-107 transduction did not significantly affect Rit1 mRNA expression, p = 0.965, two-tailed Student's t test, n = 3. E, DAT internalization assays. Stable DAT-SK-N-DZ cells were transduced with the indicated lentiviral particles, and DAT internalization rates were measured 96 h post-transduction as described under “Experimental procedures.” Data are presented identically as in C. *, p = 0.03, one-tailed Student's t test, n = 5.

