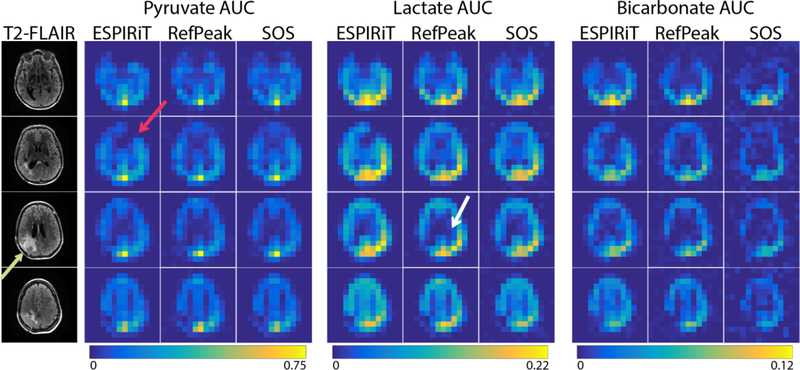
Figure 4:
Brain patient data with 1H T2-FLAIR images (treated lesion post-resection indicated by the green arrow) and AUC images acquired with EPI of three metabolites using a 32-channel 13C coil. Metabolite maps are shown on a normalized scale, with each reconstruction normalized to the maximum pyruvate signal. The white arrow highlights the different lateral ventricle contrast shown with the RefPeak method, while the red arrow points out a region with nulled signal by the ESPIRiT reconstruction, a result of the sensitivity map estimation.

