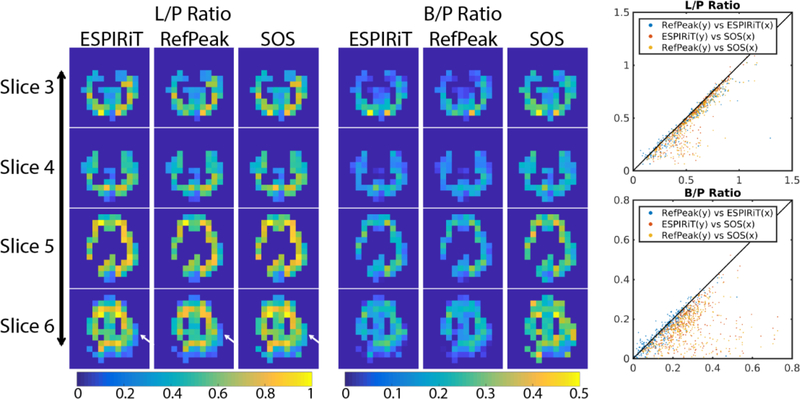
Figure 5:
Quantified lactate-to-pyruvate and bicarbonate-to-pyruvate ratios (L/P and B/P) of each voxel were plotted as scatter plots to compare three coil combination methods. The diagonal black line represents complete agreement between the methods. The masks were selected based on pyruvate SNR (voxels with SNR greater than 10) on a slice-by-slice basis, with the same mask applied to all three metabolite images. The white arrows indicate minor differences between the lactate-to-pyruvate ratio maps. Scatterplots on the right show good agreement between the RefPeak and ESPIRiT coil combination methods, while the SOS method tends to overestimate the ratio when SNR is low, in agreement with simulation results.

