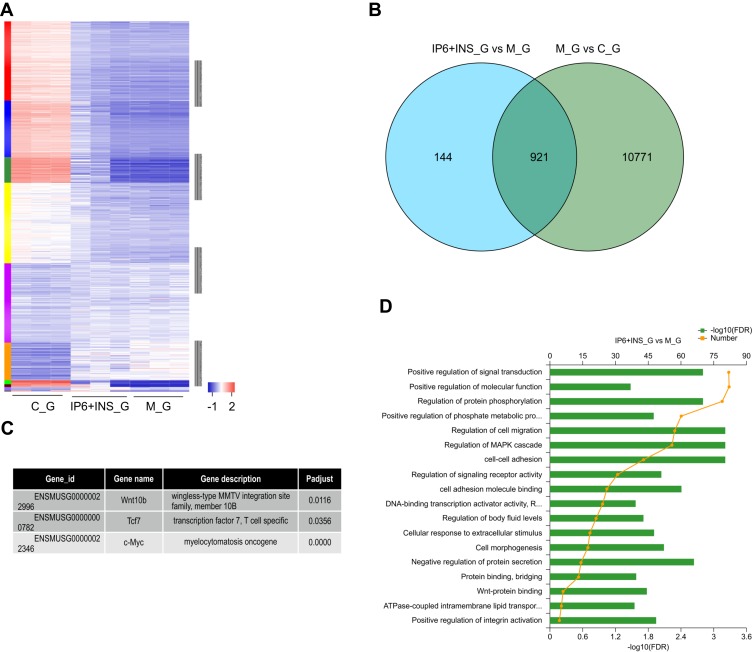
Figure 4.
RNA-seq results regarding the comparison of colonic tissues from C_G and primary tumor tissues from M_G and IP6+INS_G. (A) The heatmap of differentially expressed genes in different groups. The gene expression of C_G, M_G, and IP6+INS_G leads to distinct transcriptome profiles. (B) Venn diagram of differently expressed genes in different groups. The differently expressed genes regulated by IP6+INS between M_G and C_G. (C) Wnt10b, Tcf7, and c-Myc differently expressed according to the RNA-seq results. (D) Bar plot of the GO analysis of the differently expressed genes regulated by IP6+INS between M_G and C_G (p < 0.05).

