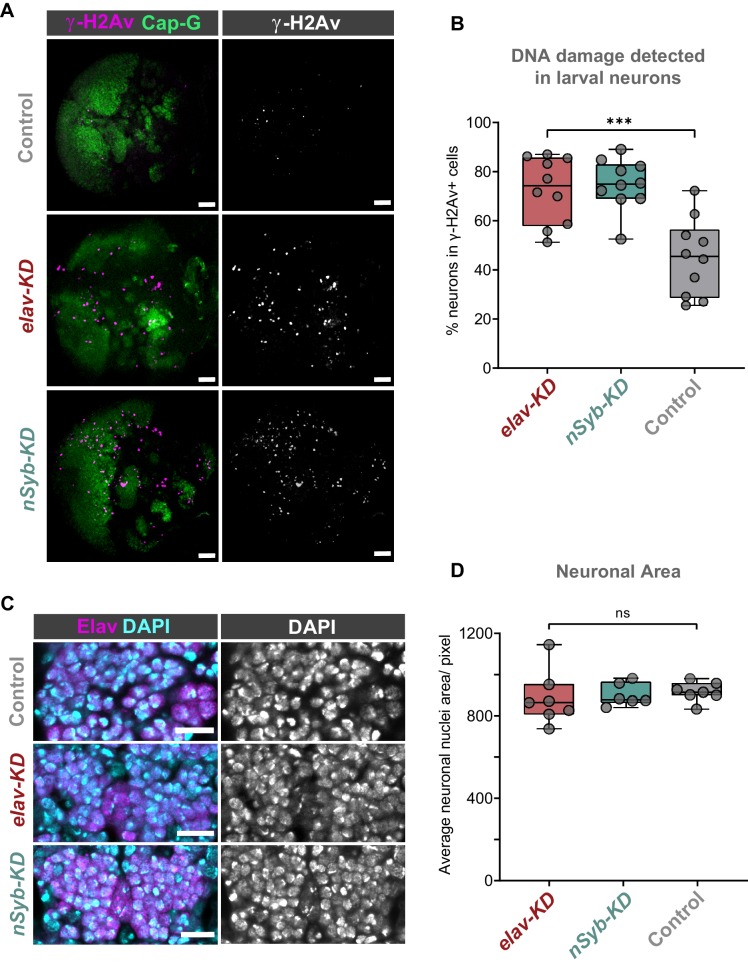
Figure 3. Cap-G knockdown leads to increased DNA damage in larval neurons.
(A) Larval optic lobes for Cap-GEGFP controls and Cap-G KD genotypes. γ-H2Av indicates DNA damage, Cap-G signal is strongest in dividing cells. Scale bars 10 µm. (B) Quantification of γ-H2Av+ neurons as percentage of total γ-H2Av+ cells. 10 biological replicates per genotype. Kruskal-Wallis test one-way ANOVA (***, p<0.001). (C) Section of embryonic VNC (ventral view) stage 15 for all genotypes. Elav to mark neuronal nuclei and DAPI as nuclei stain. Control (Cap-GEGFP), elav-KD and nSyb-KD genotypes. (D) Quantification of neuronal nuclei area. Pixel area average of at least 1000 cells per replicate was analysed. seven biological replicates per genotype. No statistical difference determined by one-way ANOVA (p>0.5).

