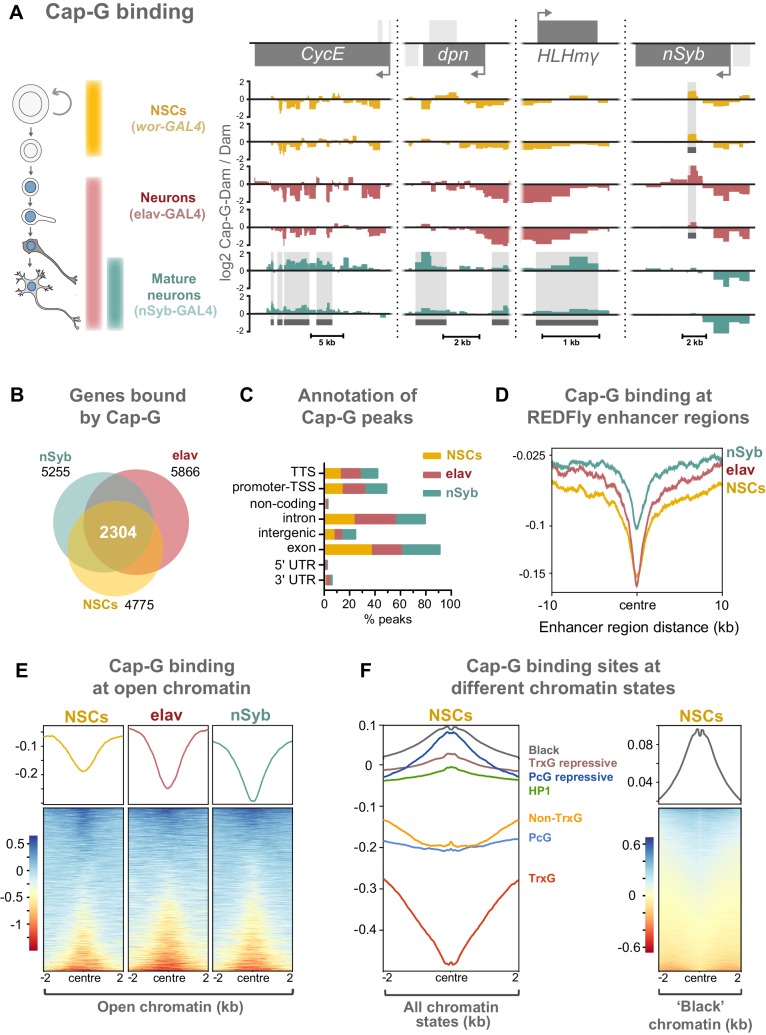
Figure 4. Cap-G binds to DNA in NSCs and neurons.
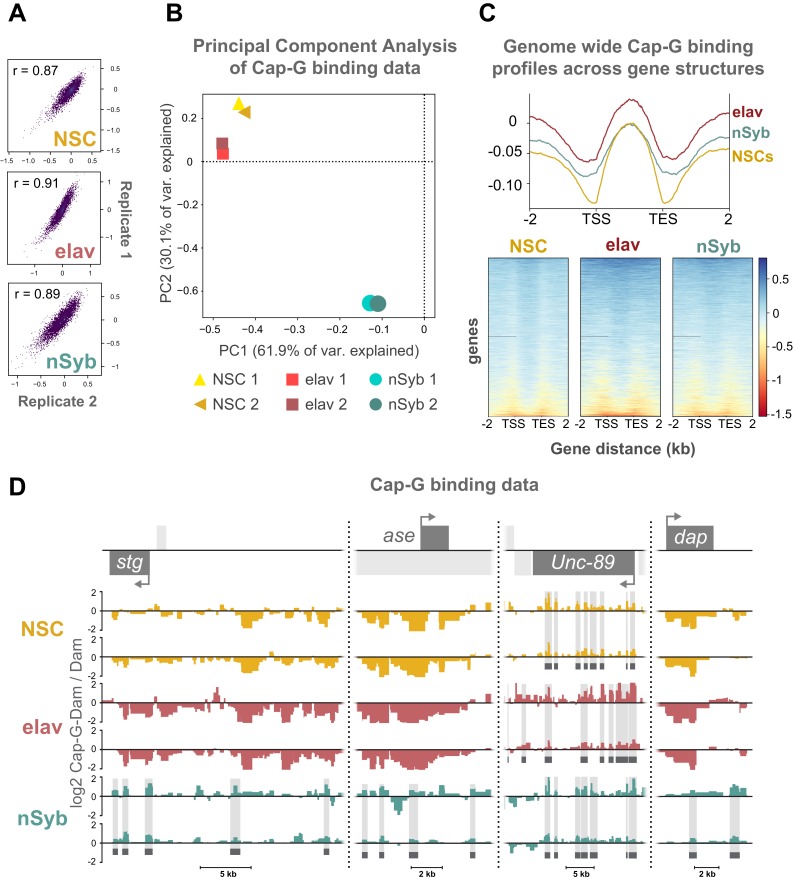
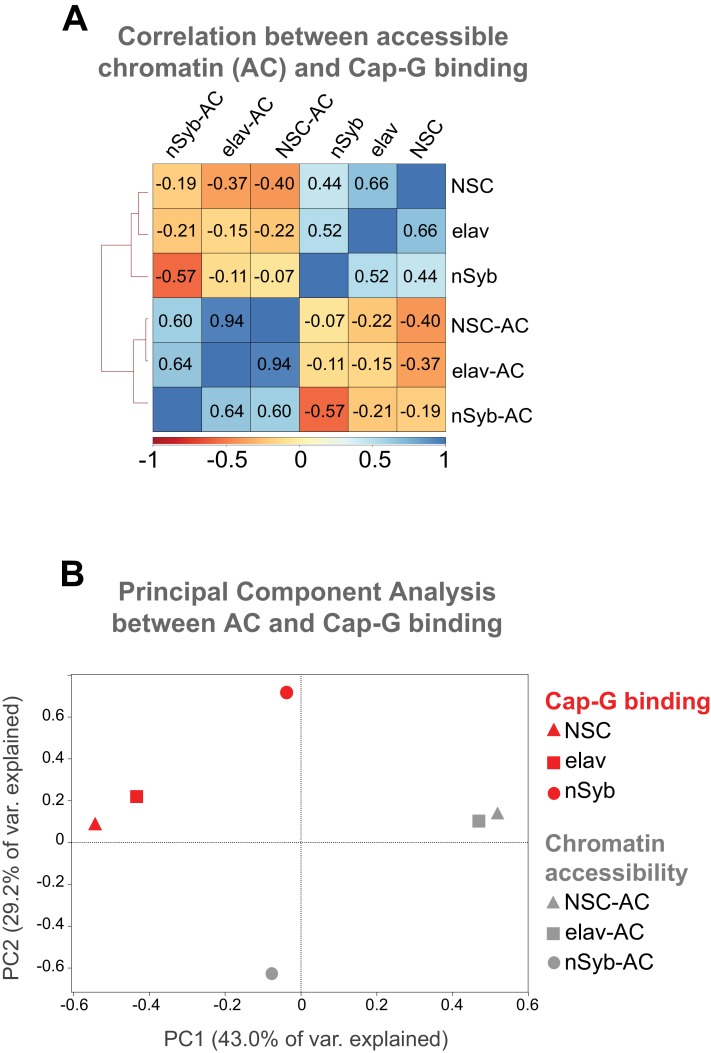
(A) Cap-G binding at example loci in NSCs (wor-GAL4), all neurons including immature neurons (elav-GAL4) and mature (nSyb-GAL4) neurons. Light grey boxes on the gene annotation tracks represent other genes. Horizontal grey bars on the data tracks indicate statistically significant peaks. Y-axes display normalised ratio of log2 Cap-G-Dam/Dam. N.b. since TaDa data is normalised to Dam-only signal it is normal to observe ‘negative peaks’ at sites of depleted binding that have higher background Dam-only methylation. (B) Venn diagram showing unique genes bound by Cap-G and the total overlap between all cell types. (C) Genomic annotation of Cap-G peaks shows enrichment in gene bodies (introns and exons) whilst binding at non-coding regions are depleted. (D) Cap-G binding is depleted at known Drosophila Regulatory Elements (REDfly, http://redfly.ccr.buffalo.edu/index.php). Profiles plotted against centre of enhancer region and 10 Kb up/downstream. (E) Average Cap-G binding is depleted at accessible chromatin for all cell types. Plot shows 2 Kb up/downstream centre of an open chromatin region. Note that a subset of sites appear enriched for Cap-G binding (blue lines on heatmap) (F) Average Cap-G binding in different chromatin states in NSCs. Cap-G binding is enriched in repressive states (Black, HP1, TrxG-repressive, and PcG repressive), and depleted in permissive chromatin states (non-TrxG, TrxG, and PcG). Heatmap is shown for the most highly enriched ‘black’ state (non-HP1, non-PcG repressive state).


