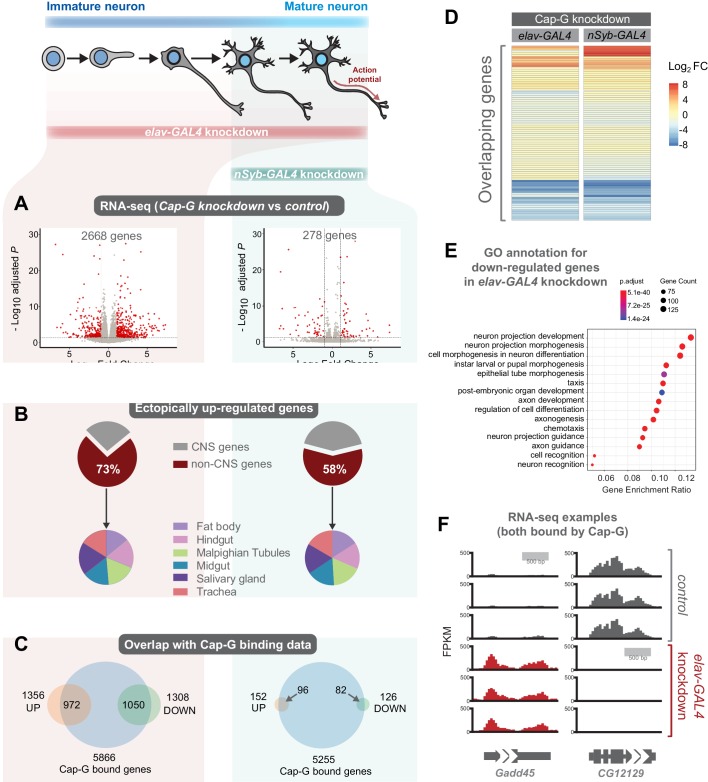
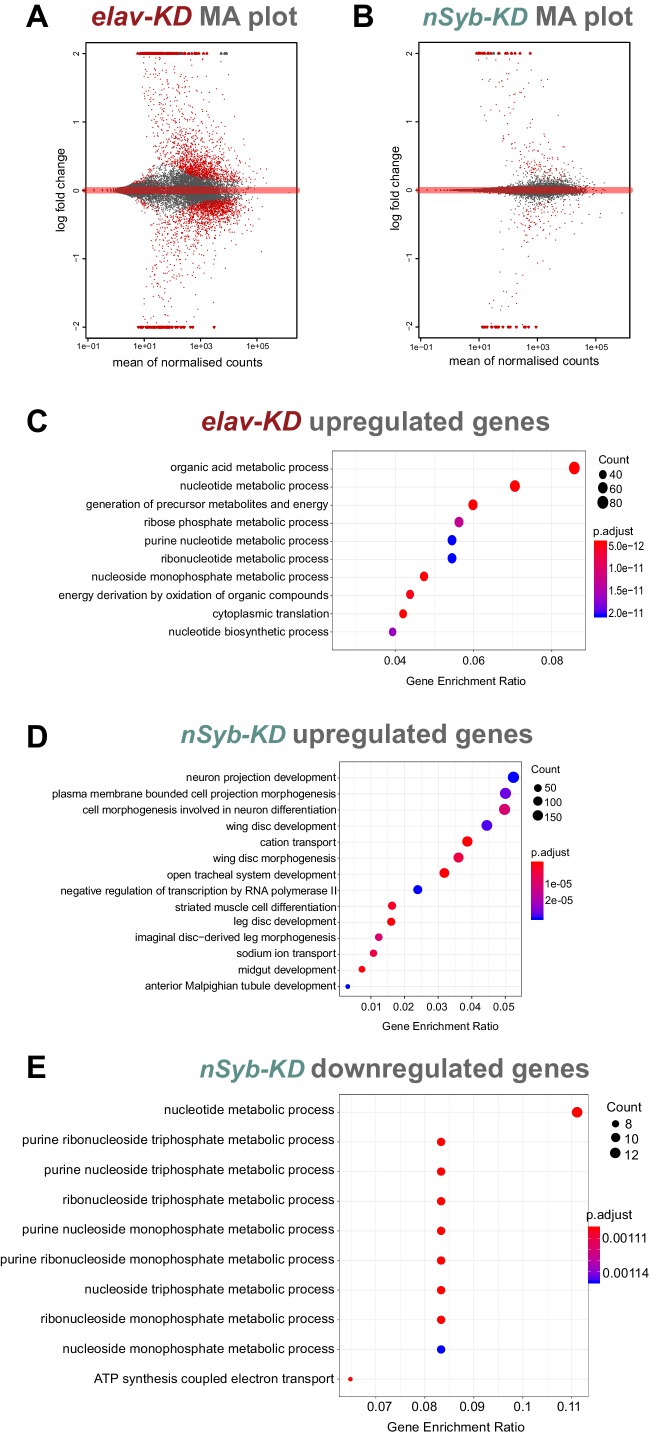
Figure 5. Cap-G knockdown in neurons display severe misregulation of gene expression.
(A) Volcano plots showing differentially expressed genes in elav-KD and nSyb-KD respectively. Significant differential expression marked in red by a Log2 fold change > 1 or <-1 and FDR < 0.05. Control genotypes are elav-GAL4; UAS-deGradFP and nSyb-GAL4; UAS-deGradFP for elav-KD and nSyb-KD respectively. (B) Pie charts showing tissue of origin expression data for upregulated genes in Cap-G KD datasets taken from FlyAtlas. The majority of genes are not normally expressed in the CNS but in alternative tissues. (C) Venn diagrams showing significant overlap between Up/Down regulated genes and Cap-G DamID peaks for elav and nSyb neurons respectively, Fisher’s exact test (p<1×10⁻²⁰). (D) Heatmap of overlapping differentially expressed genes between elav-KD and nSyb-KD. (E) Enriched Gene Ontology analysis of downregulated genes from elav-KD shows mostly neuron-specific terms. (F) Example of differentially expressed genes directly bound by Cap-G in elav-KD (all three replicates displayed).


