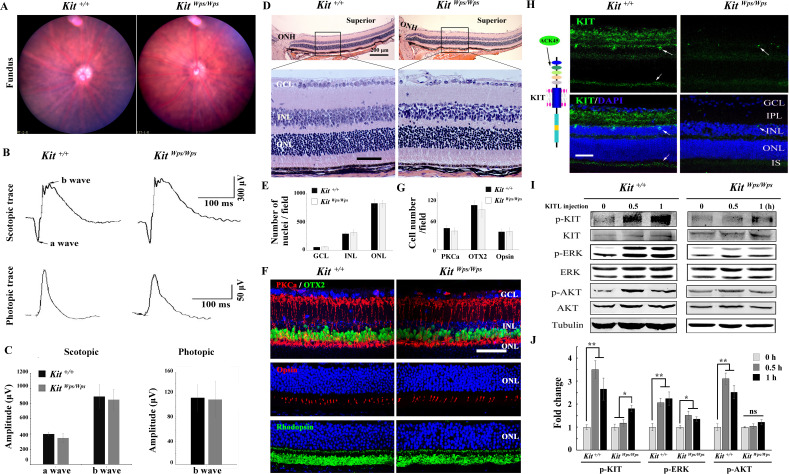
Figure 2. No changes in retinal cell distribution and structure, but disruption of Kit activation in KitWps/Wps retina.
(A) Fundus images of 2-month-old Kit+/+ and KitWps/Wps mice. (B) ERG traces of Kit+/+ (left panels) and KitWps/Wps (right panels) retinas under scotopic (upper panels) and photopic conditions (lower panels). (C) Quantification of ERG amplitudes under scotopic and photopic conditions. (D, E) Histological images of H and E staining from 2-month-old Kit+/+ and KitWps/Wps retinas (D) and quantification showing the mean number of nuclei localized at GCL, INL, and ONL over the length of 0.35 mm between 300 μm to 700 μm from the optic nerve head in dorsal retina of Kit+/+ and KitWps/Wps mice (n = 5) (E). Representative histological sections are from superior retinas 0.3 mm from the optic nerve head. (F) Immunohistochemistry for OTX2, PKCα, Opsin and Rhodopsin in 2-month-old Kit+/+ and KitWps/Wps retinas. (G) Quantification of OTX2+, PKCα+ and Opsin+ cells in the indicated retinas. Each image is representative for at least five retinas. The analyzed sectional numbers are from at least 30 sections from at least five retinas. (H) Schematic representation of KIT protein structure and the location recognized by the ACK45 antibody (left panels) and immunostaining images of ACK45 antibody in 3-month-old Kit+/+ and KitWps/Wps retinas (right panels). (I) Western blots show phosphorylation of KIT, ERK and AKT in Kit+/+ and KitWps/Wps retinas after the injection of KITL (5.6 nM) at the indicated time points. (J) Quantification of western blot bands shows the phosphorylation levels of KIT, ERK and AKT. GCL, ganglion cell layer; IPL, inner plexiform layer; INL, inner nuclear layer; IS, photoreceptor inner segments; ONL, outer nuclear layer; OS, photoreceptor outer segments. Arrows in panels H indicate KIT-positive signal. * or ** indicates p<0.05 or p<0.01. Scale bar, 50 μm.


