
FIGURE 2.
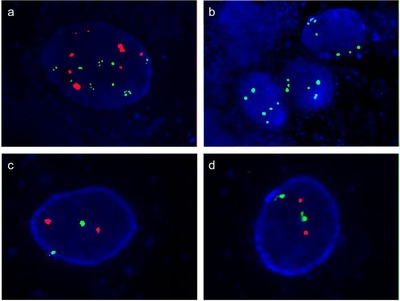
Representative images of FISH assay. (a) An example of chromosome 3 aneuploidy (green signals) and chromosome 7 aneuploidy (red signals) in the FISH image (magnification: × 1000). (b) An example of chromosome 17 aneuploidy (green signals) and p16 locus loss (no red signal) in the FISH image (magnification: × 1000). (c) An example of the normal status of chromosome 3 (green signals) and chromosome 7 (red signals) in the FISH image (magnification: × 1000). (d) An example of the normal status of chromosome 17 (green signals) and p16 locus (red signals) in the FISH image (magnification: × 1000). FISH: fluorescence in situ hybridization