
FIGURE 8.
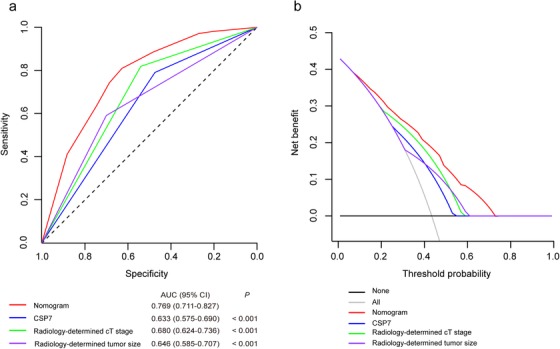
Models comparison in the whole study cohort. (a) Receiver operator characteristic curves of the models are presented to compare their discriminatory accuracy for predicting muscular invasion. P values show the AUC for the cytogenetic‐clinical nomogram versus the AUCs for other variables incorporated in the nomogram alone. (b) Decision curve analyses comparing the net benefit of the cytogenetic‐clinical nomogram versus the other variables incorporated in the nomogram alone are shown. CSP: chromosome‐specific centromeric probe; AUC: area under the curve; CI: confidence interval